Best Data from Space: How We Attain Optimal Spatial Resolution Imagery
Part one of a new technical series, courtesy of our engineers, exploring internal processes that enable us to deliver the best data from space.
In this technical series, Satellogic team members present the fundamental steps in optimizing our high-performing optical system to assure quality end-products for customers. This article, the first of the series, focuses on spatial resolution quality and our procedures to validate and calibrate the satellite’s payload in the laboratory and orbit.
Spatial Resolution Metrics
As a measure of the spatial resolution quality of imagery, Satellogic considers the metric function, the Modulation Transfer Function (MTF). We present here the method used to estimate for any spectral channels the MTF associated with the complete system response in orbit.
Then its derived quality indicators are defined, such as MTF at Nyquist and Full Width Half Maximum (FWHM), alongside with general indicators such as the Ground Resolved Distance (GRD), the Ground Sampling Distance (GSD) and the relationship between those properties.

A high-resolution capture of the Grand Canyon in the United States.
To estimate the MTF of our system in orbit, as input, a checkerboard image target acquired from space, shown in figure 1, is considered and includes edge transitions in nearly vertical/horizontal directions to estimate the MTF in the along-track/across-track axis.
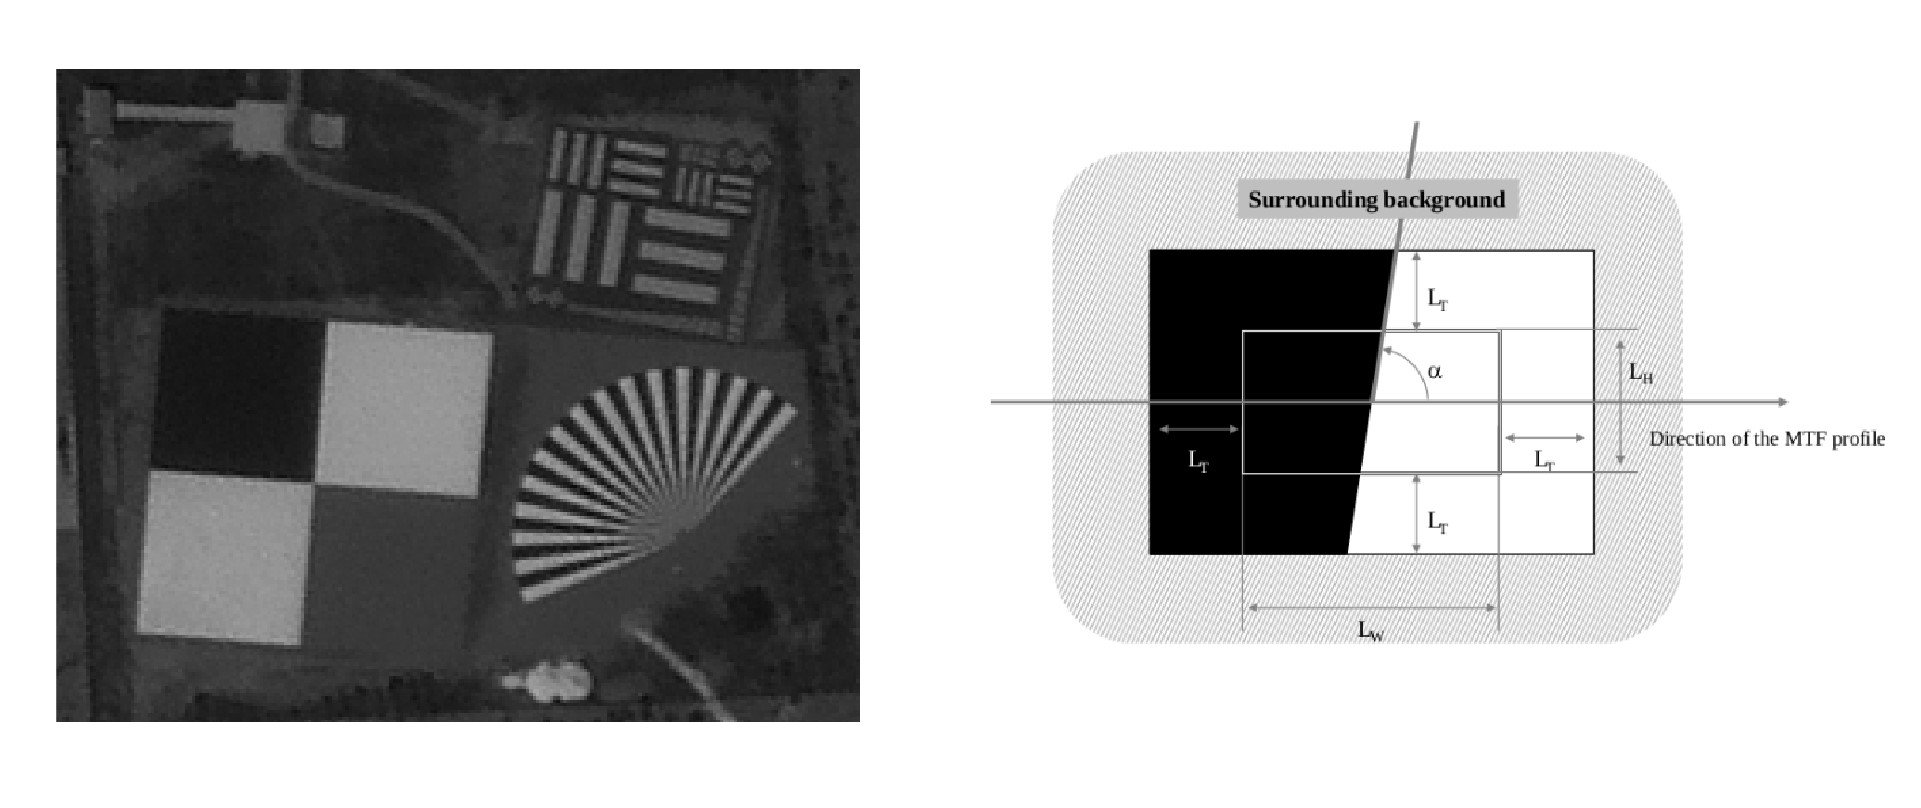
Figure 1: resolution target / Figure 2: edge patch properties
Several edge patches are extracted from the target following the ISO 12233 standard, as illustrated in figure 2: Line height (Lh): 16-pixel rows, line width (Lw) 10-pixel length, surrounded by a transition distance (Tt) of at least 1 PSF radius. In the edge modeling step, many phases of the geospatial signal are sampled in order to have a super-resolved Edge Spread Function (ESF). The ISO 12233 standard recommends a sampling factor of 4. In Satellogic, as we produce very high-resolution images, we determined, through controlled calibrations, a sampling factor of 8. Per direction, along/across track, 2 normalized ESF clusters may be measured, from the top and bottom edges of the target, as in figure 3.a. Deriving and aligning them, a series of raw Line Spread Function (LSF) is obtained, as in figure 3.b.
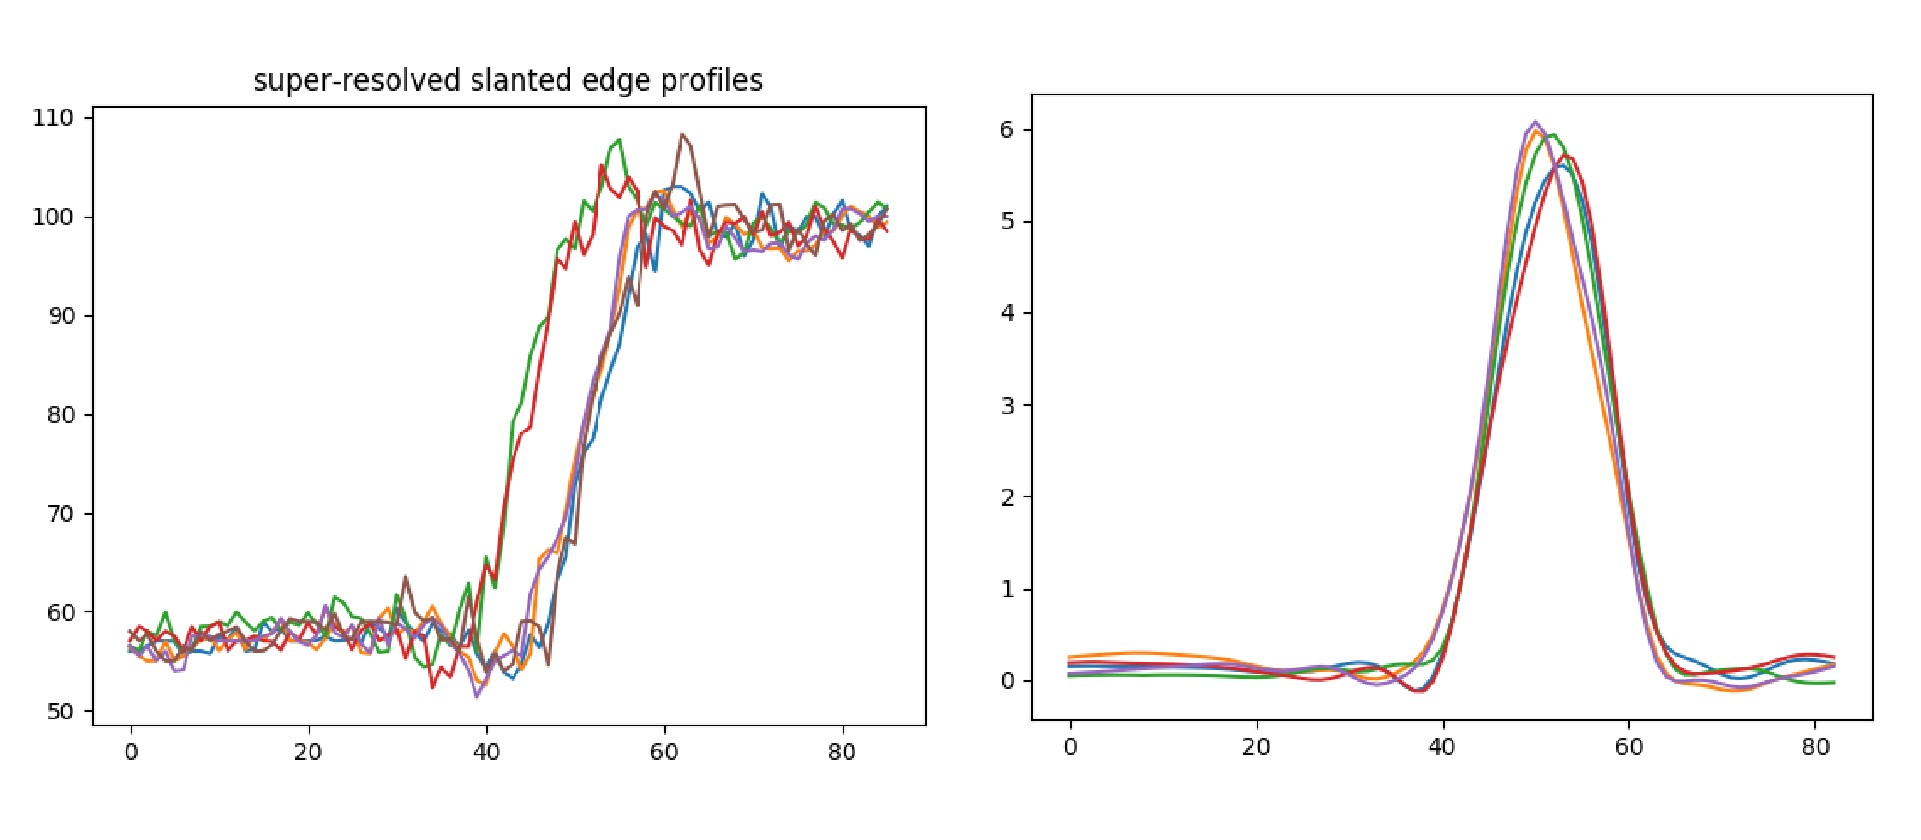
Figure 3.a: Two Edge Spread Function clusters Figure 3.b: a series of raw Line Spread Function
There, following ISO 12233:2014, an angle correction is applied, and a modified apodization noise reduction is performed to reduce noise contribution without impacting the signal response estimation at high frequencies. It is worth noting that the process does not apply any fit modeling (sigmoid for instance) and prefers to do sub-pixel LSFs fusion to obtain an MTF curve that captures a more realistic behavior of the system.
Out of the MTF estimation, two leading indicators are derived:
- The Modulation Transfer Function at Nyquist, where Nyquist is half the sampling frequency of our acquisition system, i.e 0.5 pixels. It can be considered as a good indicator for the high-frequency range. Theoretically, MTF at Nyquist + epsilon represents aliasing in our image, while MTF at Nyquist – epsilon represents our ability to discriminate high-frequency objects. Satellogic’s strategic decision on this trade-off between those two effects is around 10% MTF at Nyquist.
- The Line Spread Function Full Width Half Maximum (LSF_FWHM). Defined as the width of a line shape at half of its maximum amplitude, it is estimated from the sub-pixel LSFs fusion obtained in space as described above.
In addition, we have the following indicators:
- The Ground Sample Distance (GSD): Defined as the projection of the pixel pitch on the ground plane. This metric characterizes resolution only at detector (or final product) level, while it neglects the effect of the optics and other factors, so it has a limited capability to characterize spatial resolution. It will thus be complemented by the following indicator.
- The Ground Resolved Distance (GRD): Defined as the minimum distance on the ground between point targets that can be resolved. In Satellogic, we consider the GRD to be: GRD (meters) = GSD (meter) * LSF_FWHM (pixels)
A satellite-derived capture of the Fukushima Daiichi Nuclear Power Plant, a formerly operating nuclear power plant on Japan’s eastern Pacific coast.
Characterization and validation of our acquisition system
Backed by the above-defined metrics, the different subsystems can be analyzed and validated.
First, the telescope. Traditionally, the image quality of a high-performance optical satellite is considered excellent if diffraction of light by the optical telescope is the dominant factor limiting their performance. This occurs when the wavefront error (WFE), figure 4, caused by lens aberrations, mirror fabrication errors, and system alignment is no more than a small fraction of the wavelength.
Hence, a first characterization is performed, for every satellite and in a well-controlled environment, to measure the wavefront error of the optical acquisition system, yielding a series of local subpixel estimations of 3D Modulation Transfer Functions, across the focal plane, shown in figure 5.
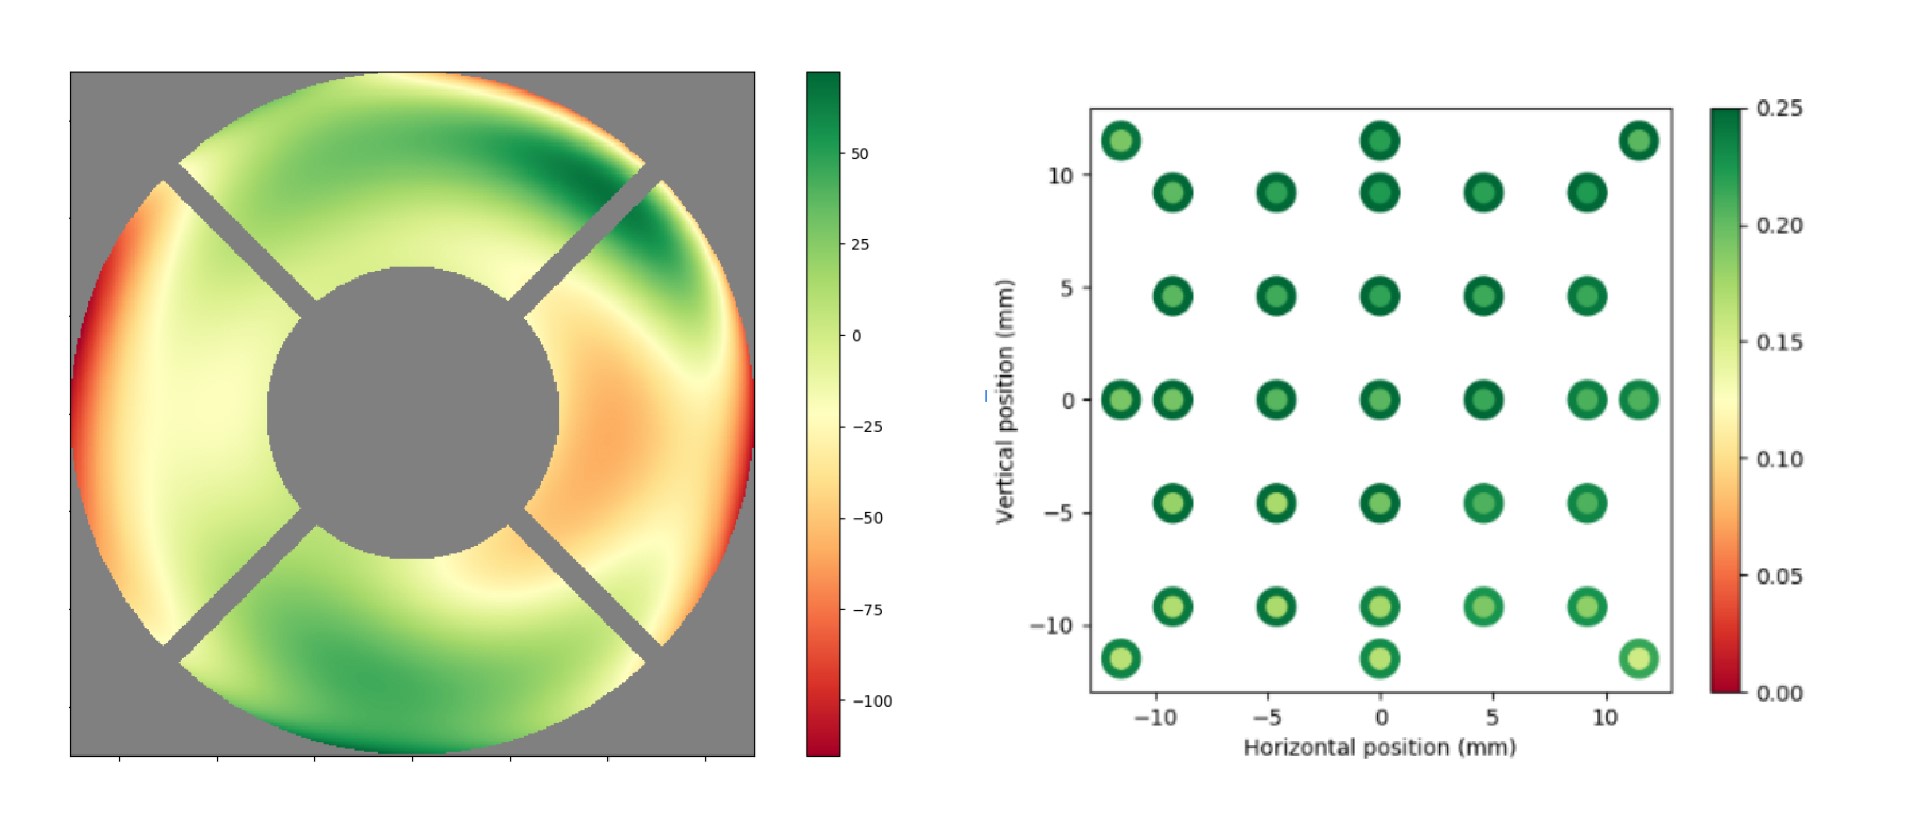
Figure 4: Wavefront Error measurement (nm) Figure 5: MTF at Nyquist (%) across focal plane
For this measurement, a Shack Hartmann sensor that emits and measures dedicated light beams at specific wavelengths is used. The approach follows those steps:
- Alignment of the telescope – Shack Hartmann sensor system in autocollimation.
- Measure the impact of gravity, and subtract it.
- Measure the WFE, decomposed into the first 37 Zernike Fringe coefficients.
With the mechanical stress, the full acquisition system endures during the launch, the satellite can have an optical misalignment issue, with, for example, a mirror tilt. In order to mitigate this risk, the characterization and validation of the optical system prior to launch, described above, is applied twice: before and after a “satellite shaking” test. Quality is then compared, and when no difference can be seen, the optical system is considered safe for launch.
Second, the focal plane position. In the hours following the launch, in order to mitigate the mechanical stress endured by the payload, a focus exploration procedure is performed, where a refocusing mechanism ensures to have the sensor at the focal plane. The approach follows those steps:
- Operate the satellite to point-still a ground target with numerous features
- Capture successive images at different focuses
- Measure local sharpness indicators, such as the Tenengrad (TENG), Modified Laplacian (LAPM), Variance of Laplacian (LAPV).
- Define the focal plane from the image that maximizes those metrics.
Third, the satellite motion compensation system. In order to ensure that we have a constant and optimal performance of our satellite motion compensation system, the MTF, and other mentioned indicators are estimated in both directions, i.e., along and across track, and compared. This end-to-end system validation, combined with telemetry data, enables us to monitor the system performance at our large constellation scale.
A multispectral capture of the Golden Gate Bridge, connecting San Francisco and Sausalito in California
Satellogic’s product spatial resolution quality
In order to monitor each of our satellites, we capture three resolution targets around the world several times per month:
- Baotou, China: center coordinate: Latitude: 40.8517, Longitude: 109.6289
- Salon-de-Provence, France: center coordinate: Latitude: 43.605921, Longitude: 5.120203
- Hyderabad, India: center coordinate: Latitude: 17.034, Longitude: 78.183
For each of the obtained captures, an automatic MTF estimation is performed and the results obtained are then stored into a cloud-based catalog. Finally, a Web User Interface displays the MTF curve and the different indicators mentioned in the previous section, allowing agile monitoring of the whole fleet and fast failure detection. It is worth mentioning that the MTF, and all the above indicators, are estimated in the along-track and across-track directions.
A high-resolution capture of a motorcar circuit in Jeddah, Saudi Arabia, adjoining the Red Sea.
Satellogic delivers imagery in very high native resolution, i.e 1 m native GSD, across all spectral bands, and, as shown below, is capable of producing multispectral imagery in 70 cm GSD on all bands.
Indeed, the below results for the native resolution of 1 m have been independently verified by the United States Geological Survey in their systems’ characterization report:
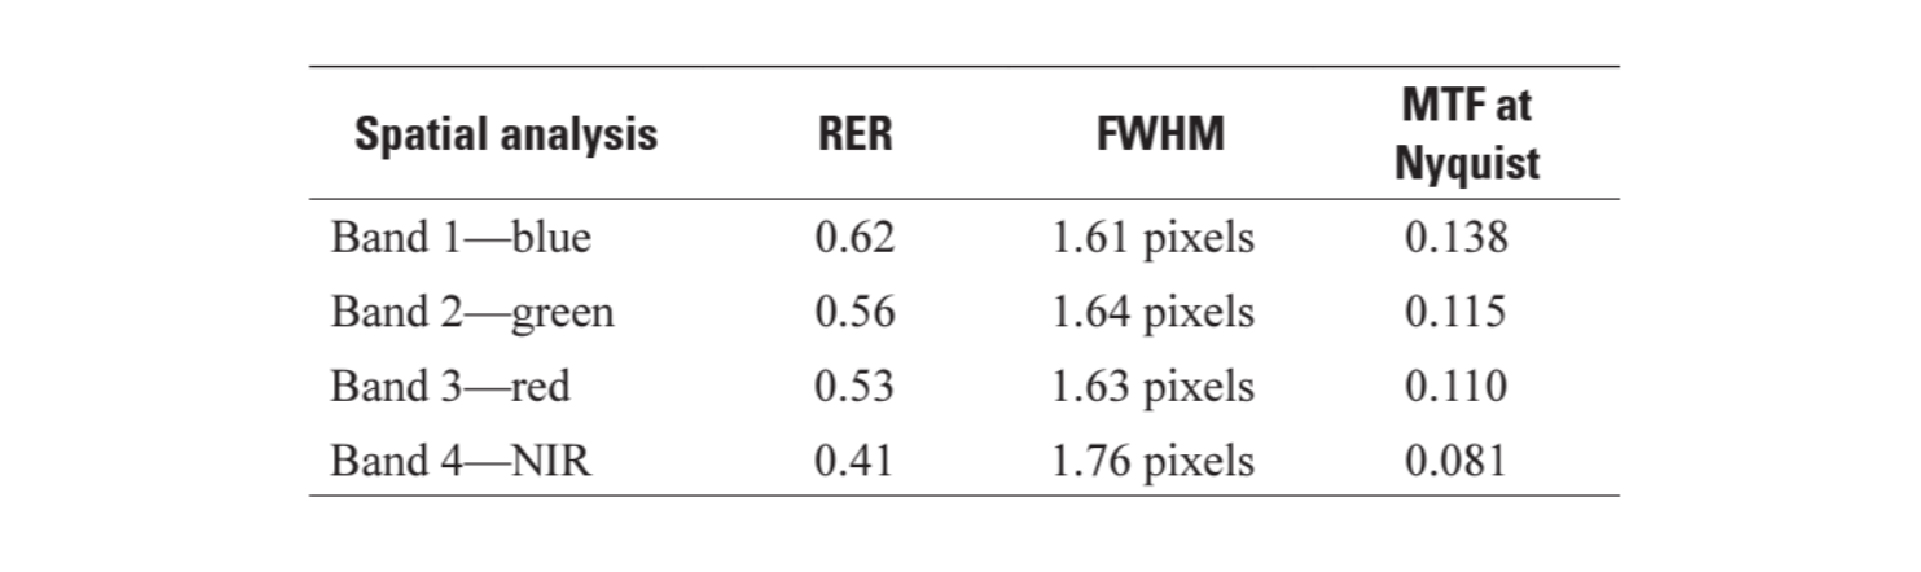
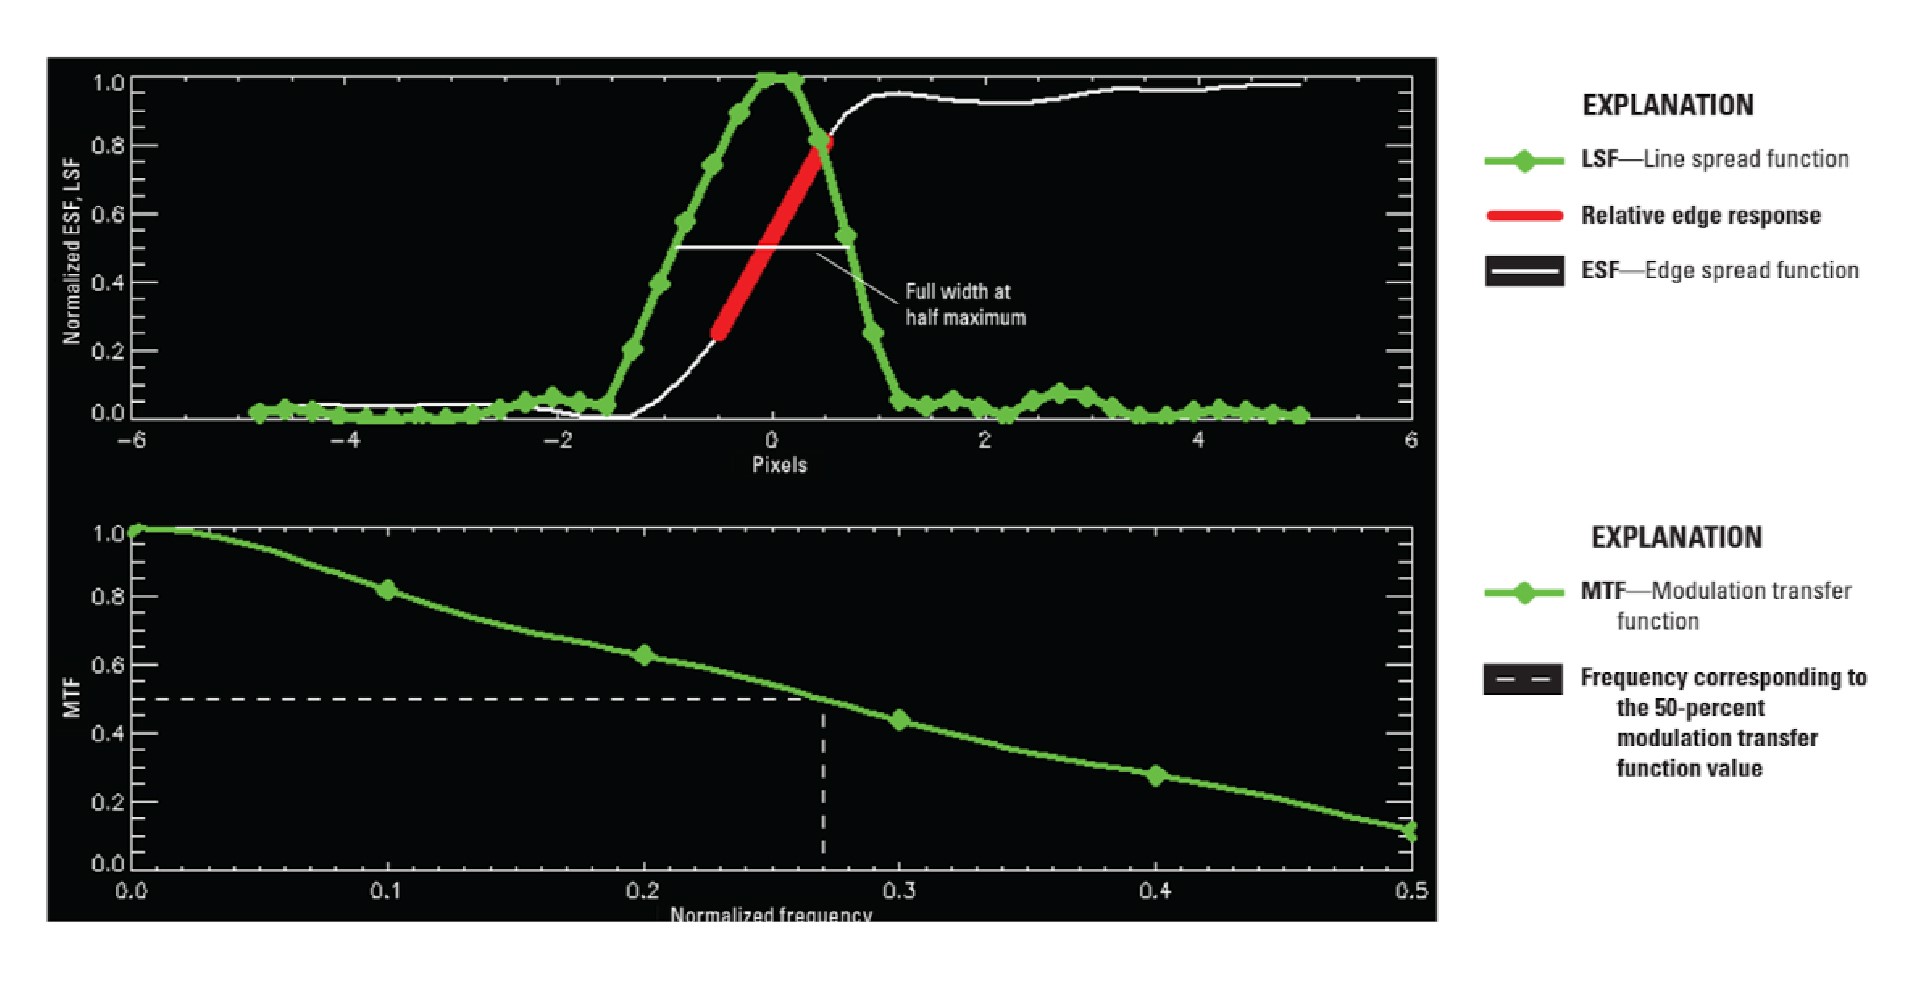
From the table and MTF & LSF graphs in green, Satellogic imagery has
- 11.5% at Nyquist for 1 m GSD
- its GRD of the system at 1.64pixels * 1 m = 1.64 m
Although there is no PAN band, all multispectral bands are high resolution for all channels and the resulting imagery is unique and in a class of its own, as this data does not require pan-sharpening. This sensing approach stands in a class of its own compared to PAN-sharpened datasets, providing considerable advantages in terms of pixel-level radiometry. This strategy enables, for example, to conduct Normalized Difference Vegetation Index (NDVI) mapping in VHR, a key use case for Space Data Portal users. It also enables LULC surveys exploiting the detailed spectral information in the classification step to deliver VHR LULC maps for the first time.
Moreover, with a GRD at 1.64m, the imagery can be upsampled slightly to 70 cm to reduce apparent aliasing.
Calibration is one of the aspects we take into consideration to deliver the best data from space. As part of our mission to democratize access to Earth Observation data, we consider these technical specs while also offering the market’s best price point.
Want to learn more about our satellite constellation? Let’s start a conversation. Contact Sales.