Harnessing Satellite Imagery Archives for Strategic Decision Making
By Solange Uwera, Senior Presales Engineer
Explore an Extensive Archive of Data from Satellogic
Satellite imagery archives play a critical role as precious reservoirs of historical data, preserving snapshots of the Earth’s surface across time. These archives empower researchers, scientists, policymakers, and diverse industries to monitor changes, track trends, and gain insights into past events, environmental dynamics, and human activities.
Over the years, Satellogic has accumulated a substantial collection of satellite images, which are invaluable for users seeking to understand and analyze their specific use cases. More than half of the world’s landmass has been captured by our constellation since 2020, yielding a wealth of stunning images showcasing ecosystems, cities, and infrastructure around the world.

How Satellogic Captures Satellite Images
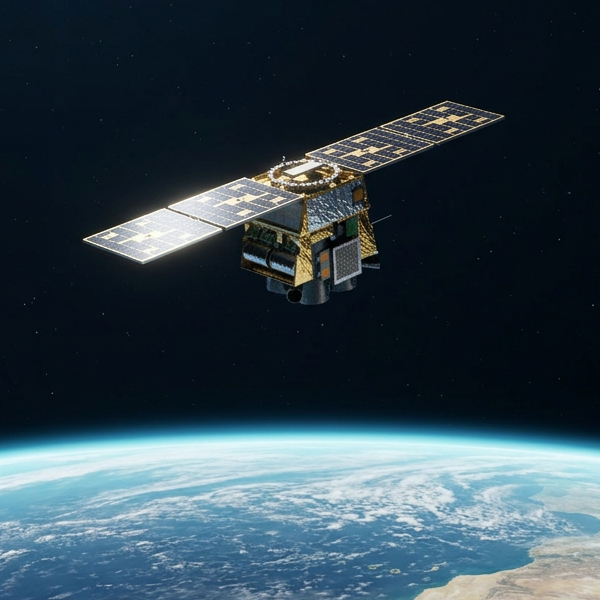
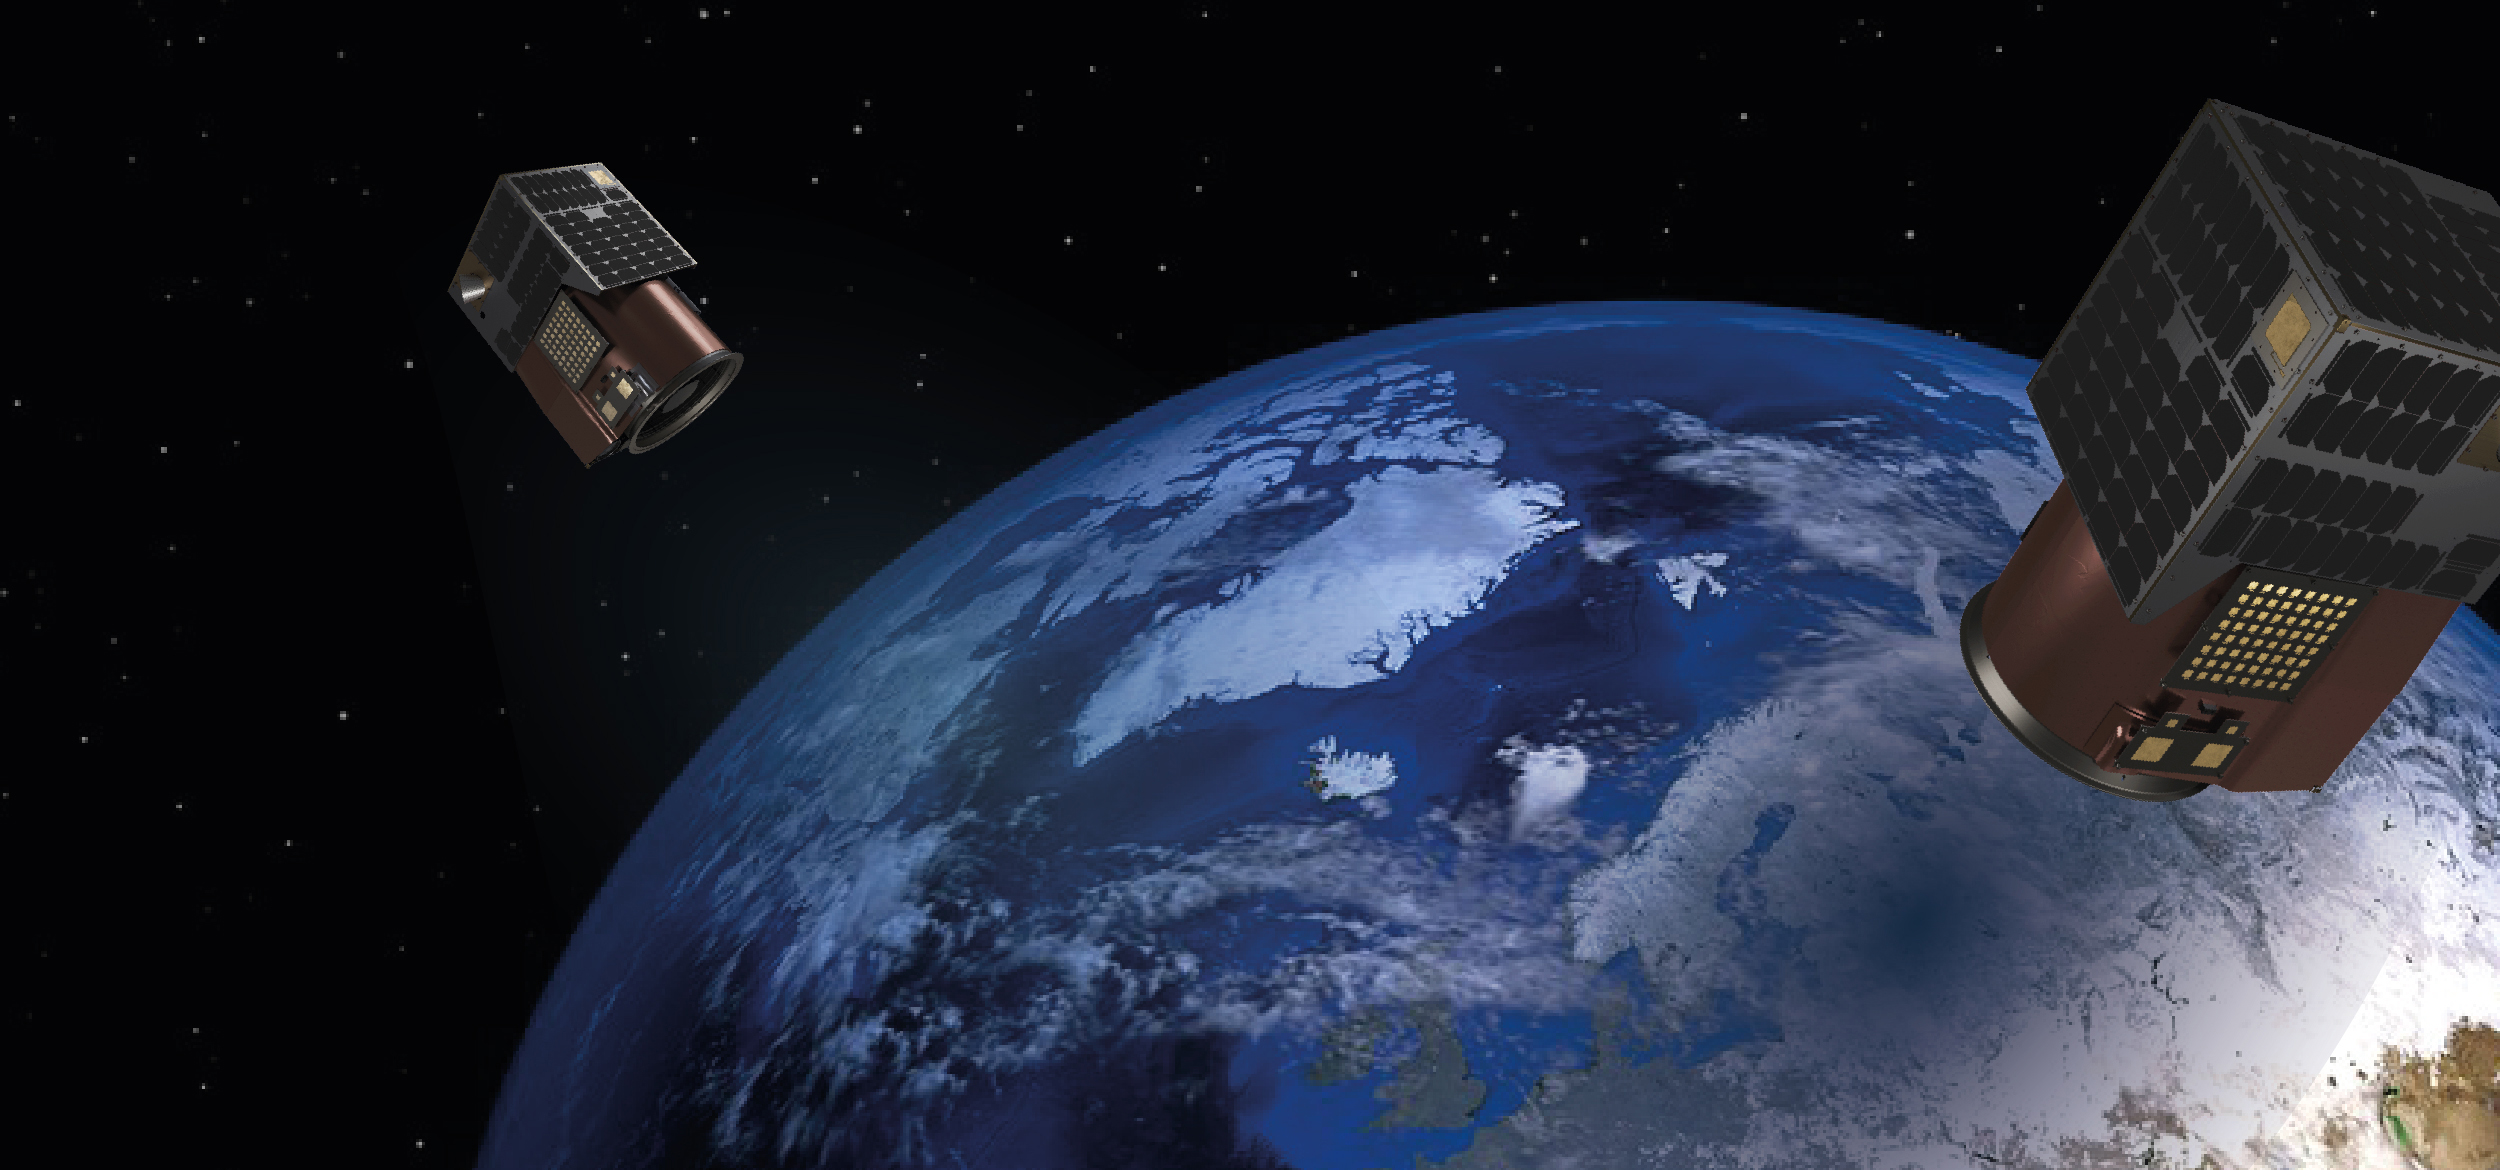
Satellogic operates a large constellation of satellites orbiting the Earth 24-hours a day, capturing the wonders of the planet as the sun rises across the world. Each satellite in our constellation is equipped with a multispectral sensor that relies on sunlight to collect images of the Earth’s surface in visible and near-infrared wavelengths, enabling us to capture what the naked eye can and cannot see.
These satellites orbit the upper atmosphere at around 480 km in altitude, also known as Low Earth Orbit, or LEO. They traverse from pole to pole, capturing images with a significant amount of information that can be represented in a pixel, a measure referred to as spatial resolution. The Mark IV satellites in the Aleph constellation capture images with spatial resolutions ranging from 0.7m to 1m after processing.
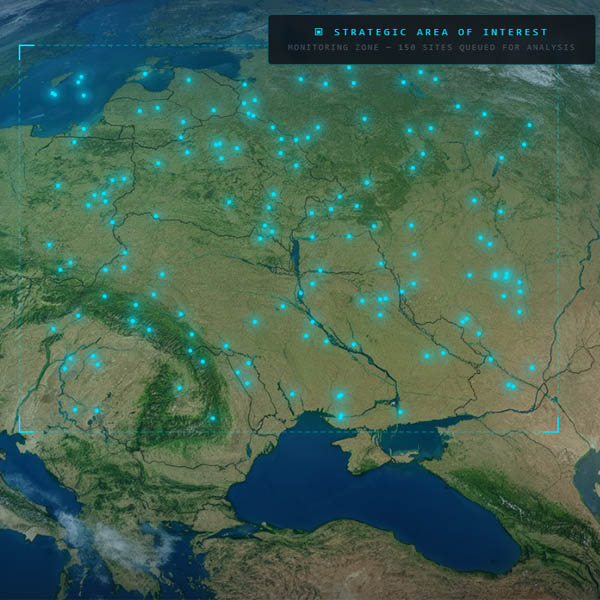
How a day looks like for the Aleph constellation.
Base data: ©2024 Microsoft Corporation, Earthstar Geographics SIO, Bing Imagery.
Satellite Imagery Archive vs Satellite Tasking
Satellite imagery is collected through tasking, a process of uplinking coordinates and commands to the satellite–letting it know when and where to capture an image. As images are collected they are processed and delivered to customers as soon as possible and/or stored in an archive (depending on contract and privacy terms). An archive typically encompasses multiple images of many places, offering data to assess change over time.
Archive data is critical for many geospatial applications, but is particularly valuable for emergency response and climate change studies. An archived image provides a foundation for what was, while a recently tasked image can reveal what is changing. Together, these images enable analysts to identify damaged areas, at-risk areas, and even safe routes for emergency response crews to reach those in need.
Here are some examples:
How to choose an appropriate archive image
The choices of archive images vary depending on the specific use case. For features subject to seasonal changes, it’s crucial to analyze satellite images captured during the same season, preferably on the same date, although this may not always be feasible. Other applications require more frequent monitoring, such as crop monitoring. In the following section, we’ll dive into Satellogic satellite imagery archives to examine historical changes in various use cases.
Risk Mitigation and Resilience for Water Resources: Water Reservoirs in Spain are Drying up, a View from Space
Here we can explore the extent of the impact of the drought that has affected certain regions in Spain. Due to significantly reduced rainfall, the region of Catalonia has particularly experienced one of the most severe droughts, prompting authorities to declare a state of emergency in most parts of the region, including Barcelona.
Satellite imagery can help in monitoring water resources infrastructure such as water reservoirs, not only to document historical water level variability but also in planning adaptation strategies.
From the archives, we compare two images of the Susqueda water reservoir in Catalunya, Spain. One capture on 18th February 2022 (left) and another one on 2nd February 2024 (right). This is a seasonal comparison case as mentioned above, where archive images captured in the same season are appropriate to compare events with the same weather conditions. The images show a significant water level reduction in February 2024 compared to February 2022.
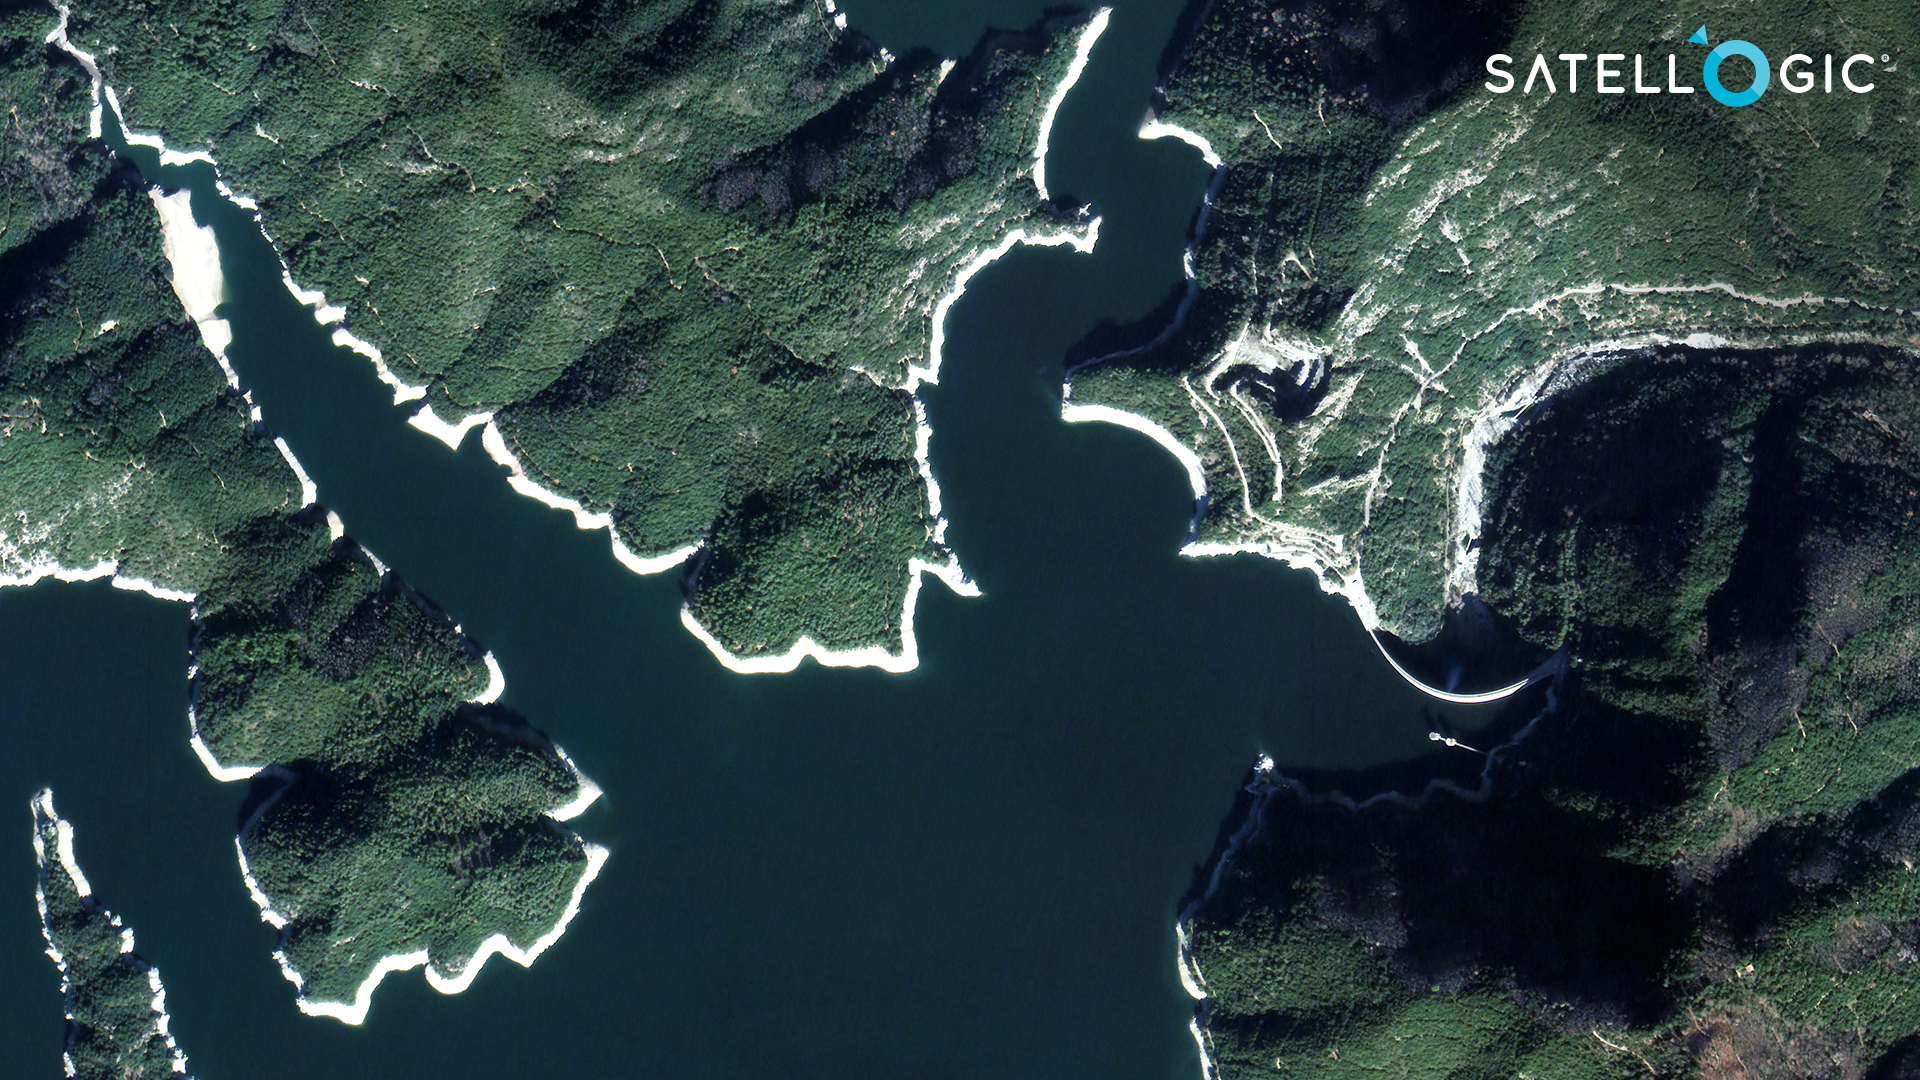
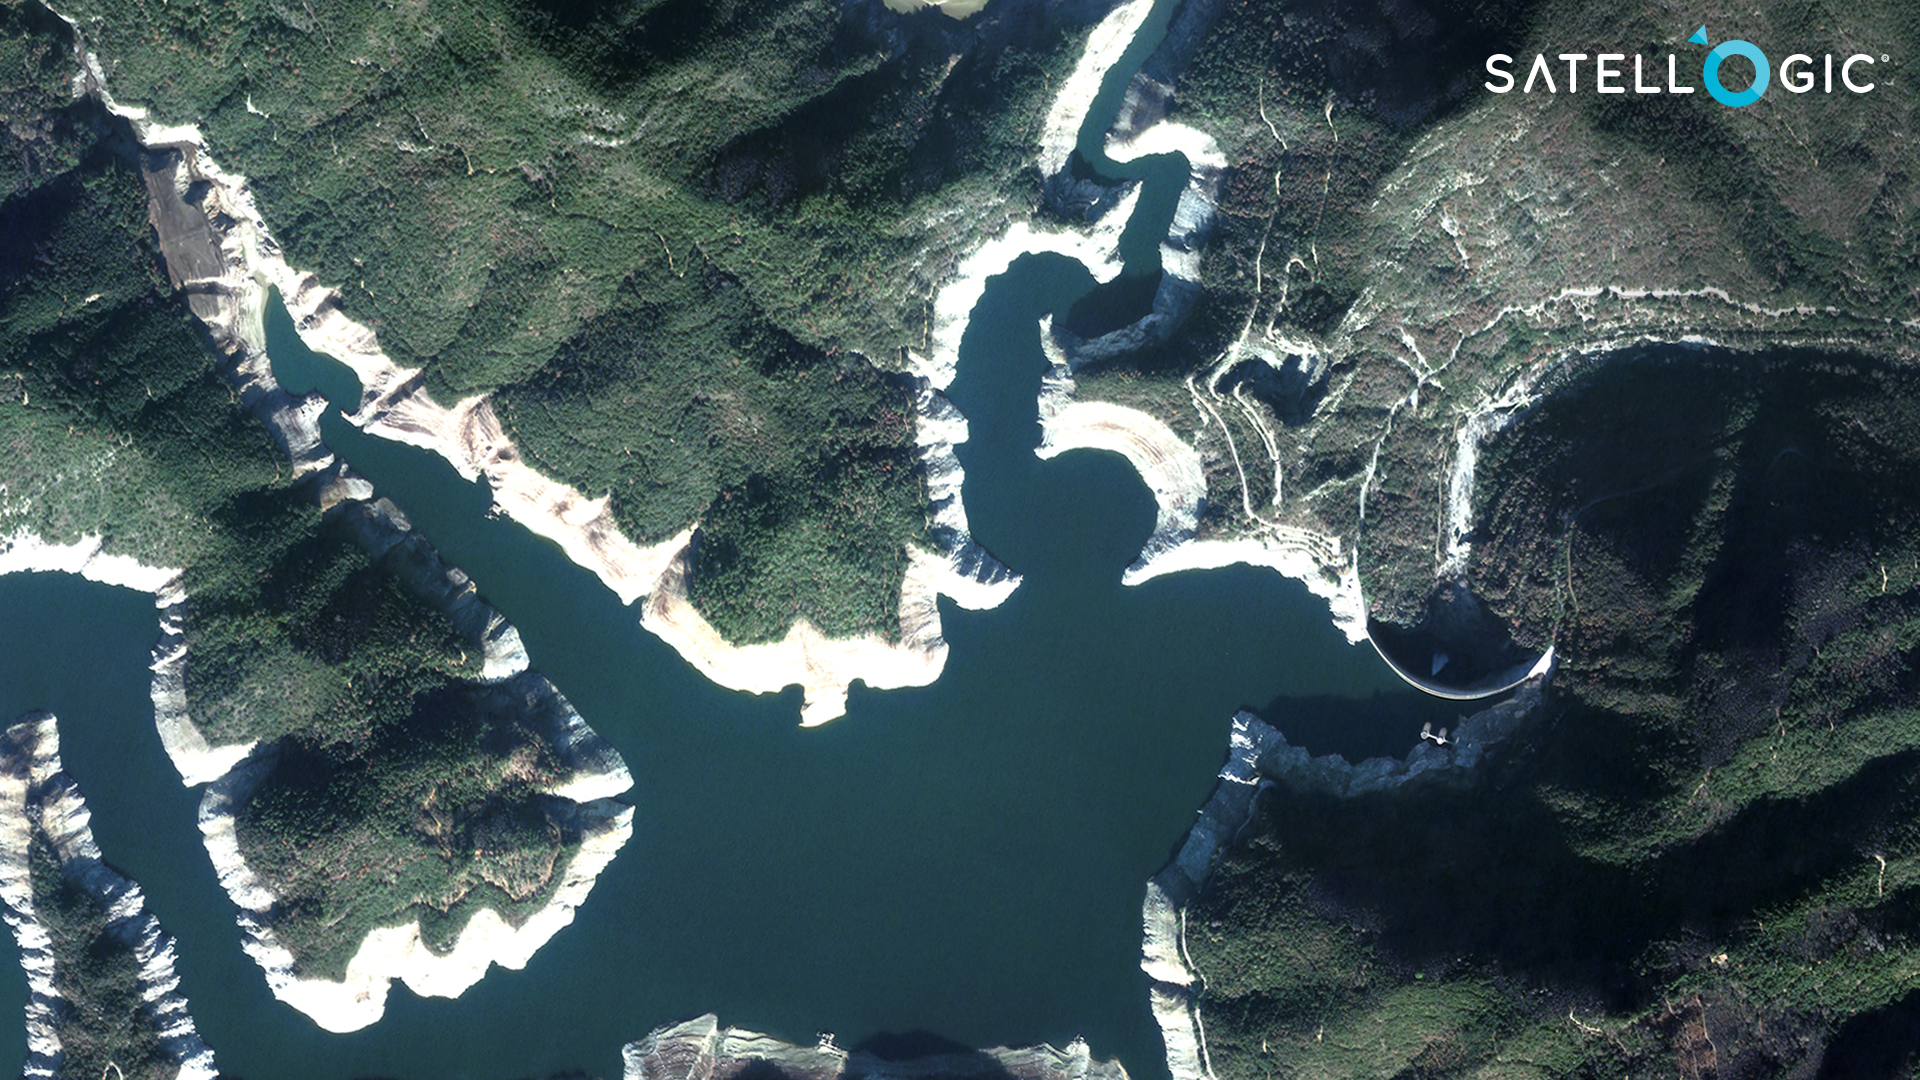
Swipe to see changes from February 18, 2022 (left) to February 2, 2024 (right)
Environmental Health Monitoring: Pink Pond Phenomenon in a Wetland in Maui Island
Keālia Pond stands as the largest remaining lowland wetland on Maui Island in Hawaii, recognized as a National Wildlife Refuge encompassing approximately 700 acres. According to the US Fish and Wildlife Service, the pond serves as a crucial nesting, feeding, and resting habitat for two endangered water bird species: the Ae‘o (Hawaiian stilt) and the ‘Alae Ke‘oke‘o (Hawaiian coot). Recent extreme drought conditions have afflicted the pond, resulting in water salinity twice the salinity of seawater. This elevated salinity has fostered the growth of halobacteria, possibly contributing to the pond’s pinkish hue.
Utilizing satellite technology, Satellogic has monitored this situation, capturing time series imagery to track the recovery of Keālia Pond. As evidenced by the images below, the increase in water levels within the wetland has facilitated a return to the ponds’ natural state, with the distinctive pink coloration gradually disappearing.
Time series images showing how the whole wetland has regained its water level from January 8, 2024 after being totally dried on November 13, 2023.
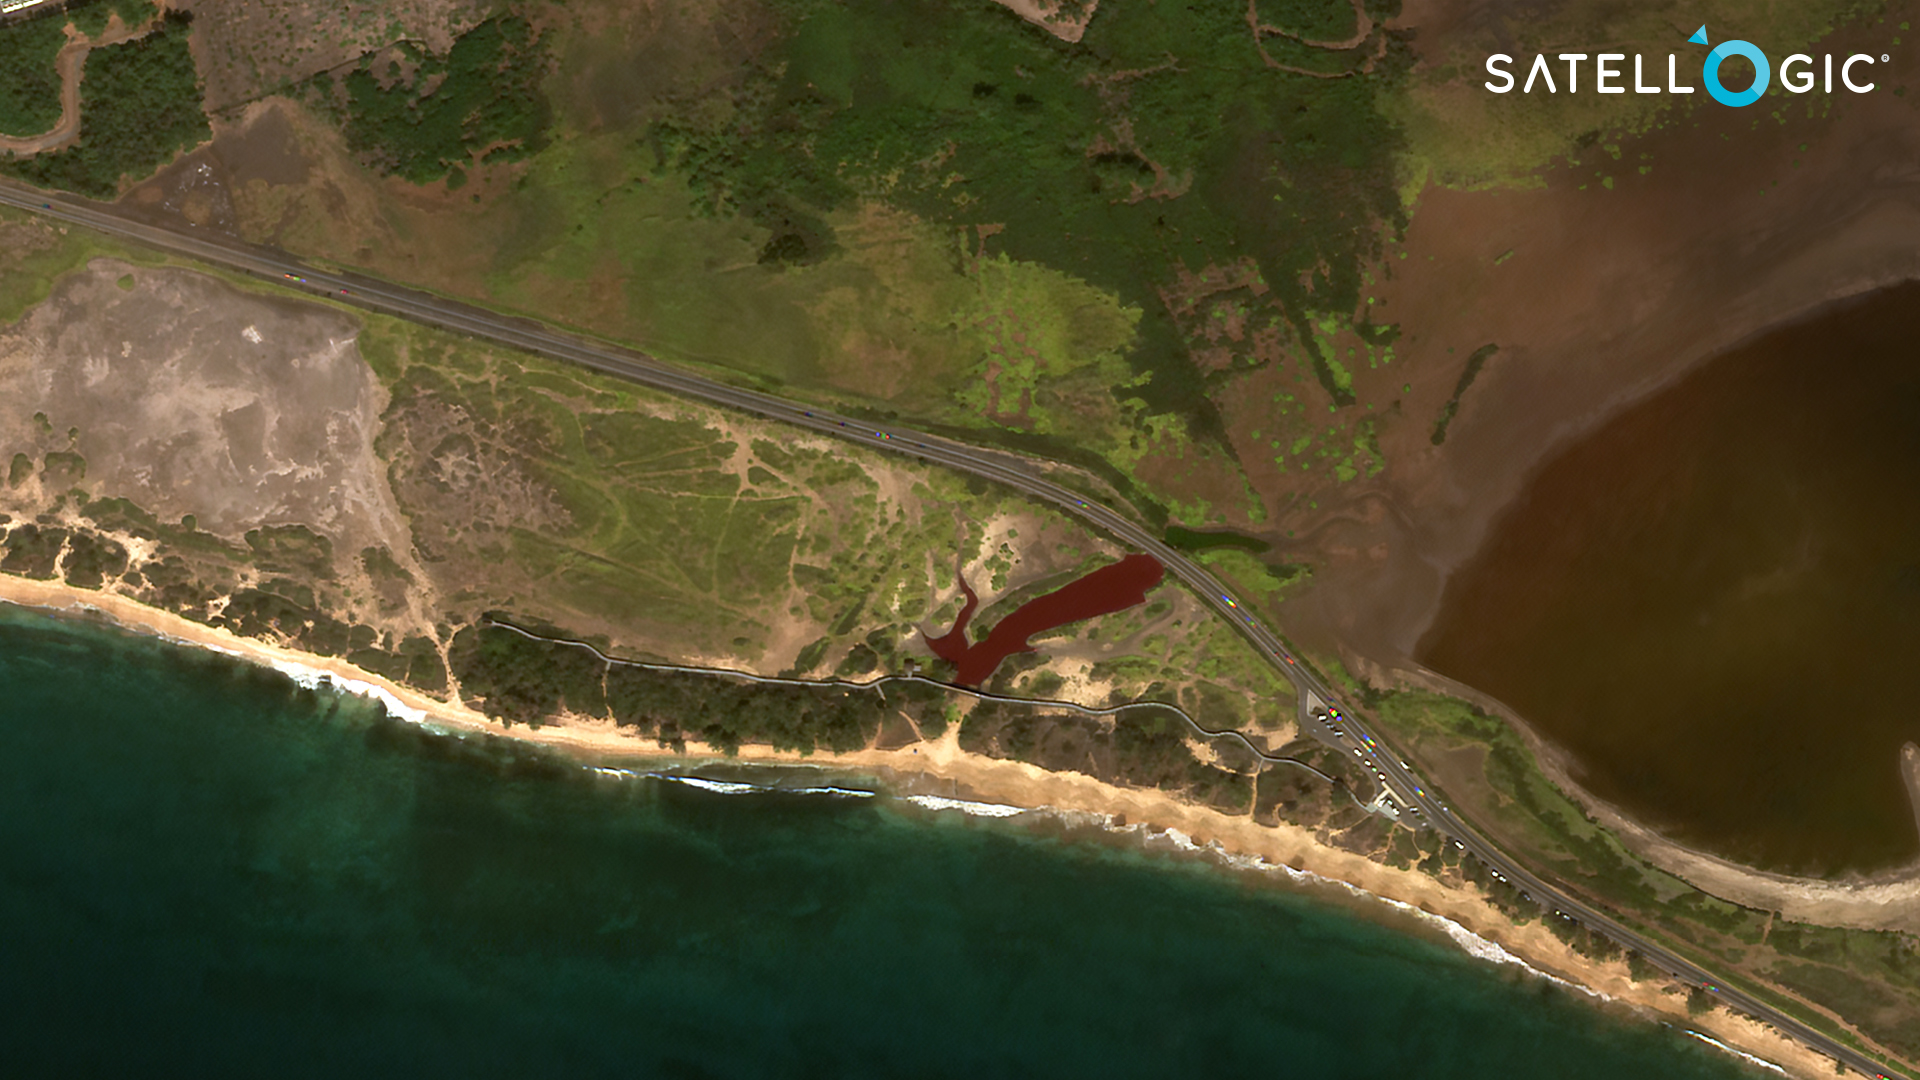
With a much closer look at the pond, it looks pink on November 13, 2023 (left) and appears to have regained its natural color on January 8, 2024 (right).
Agricultural Monitoring: Crop Health Monitoring in Brazil
Satellite imagery captured at various intervals throughout a crop season offers precise monitoring of crop health and changes across different growth stages. This monitoring holds numerous benefits, including facilitating strategic crop rotation planning through the assessment of individual crop performance and enabling comparisons of crop performance across seasons. Additionally, these benefits extend to serving as a valuable resource for insurance claims, estimating agricultural losses and gains, and more.
By tracking croplands in Pradópolis, Brazil, and referencing an image from August 2023, we can observe how the crops evolve each month from November 2023 to January 2024.
While visual analysis provides some insight into crop conditions, it may not offer a clear distinction between crop growing patterns. The Normalised Difference Vegetation Index (NDVI) emerges as a powerful method for assessing crop health by estimating the chlorophyll content in the leaves, providing a more precise understanding of crop health and growth patterns.


Top: A 1m spatial resolution visual image showing crop change from August 7, 2023 to January 7, 2024. Bottom: NDVI analysis shows crop changes in leaf chlorophyll content throughout the growing season. From low chlorophyll (indigo) to high chlorophyll content (yellow).
In conclusion, the utilization of satellite imagery archives empowers stakeholders to gain deeper insights into the long-term patterns of our planet and life on Earth. Furthermore, these archives serve as vital references for validating models, conducting research, and facilitating evidence-based decision-making across diverse fields, spanning from environmental science and conservation to urban planning and disaster response.
Satellogic Archive Data is available on the SkyFi App and EarthCache. Or check out our Developer Center to learn how you can integrate imagery with APIs and explore our suite of imagery products.