Unlocking New Possibilities with Mark V Satellite Imagery
By Antonio San Jose, Remote Sensing Engineer
Use Cases in Agriculture and Forestry
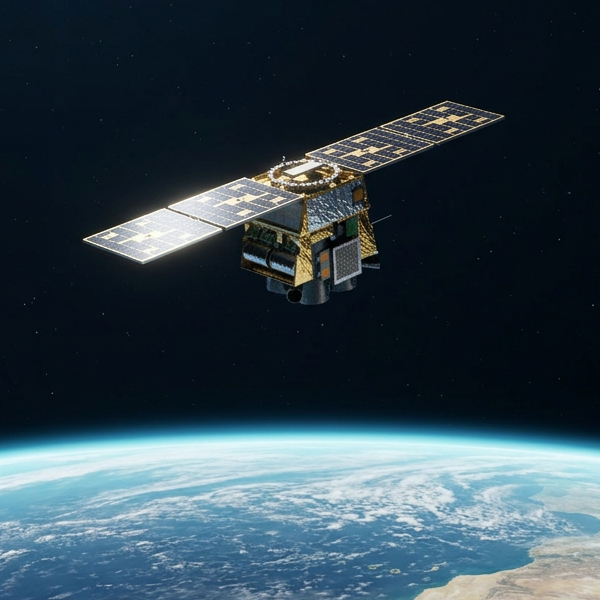
In previous posts, we introduced the cutting-edge Mark V satellite series, detailing its advanced specifications and capabilities. The Mark V stands out with its exceptional spatial resolution, thanks to a super resolution algorithm, and consistent spectral resolution across all four bands (red, green, blue, and NIR) without the need for pan-sharpening. These features empower users to apply diverse workflows and derive high-quality products across various industries. In this blog, we’ll explore the practical applications of the Mark V satellite in the fields of agriculture and forestry, showcasing its transformative impact on these sectors.
The main advantages of Mark V are the following:
- Native resolution: 70cm
- Super Resolution: 50cm
- Bands: red, green, blue and NIR at same resolution with no need of pan-sharpening
- Swath width: 6.5km
The spatial resolution provided by the super resolution algorithm in combination with the spectral resolution provided by the 4 bands with the same resolution (no need to pan-sharpening) allow our users to apply different workflows to get derived products for several industries.
in this case we are going to show some use cases for agriculture and forestry.
Agriculture
One of the most important applications of Remote Sensing in agriculture is Precision agriculture.
- Precision agriculture (PA) provides the tools and technologies to identify in-field soil and crop variability, offering a means to improve sub-field level farming practices and optimizing agronomic inputs1.
- Precision agriculture (PA) entails the application of a suite of such technologies to optimize agricultural inputs to increase agricultural production and reduce input losses. Use of remote sensing technologies for PA has increased rapidly during the past few decades. The unprecedented availability of high resolution (spatial, spectral and temporal) satellite images has promoted the use of remote sensing in many PA applications, including crop monitoring, irrigation management, nutrient application, disease and pest management, and yield prediction2.
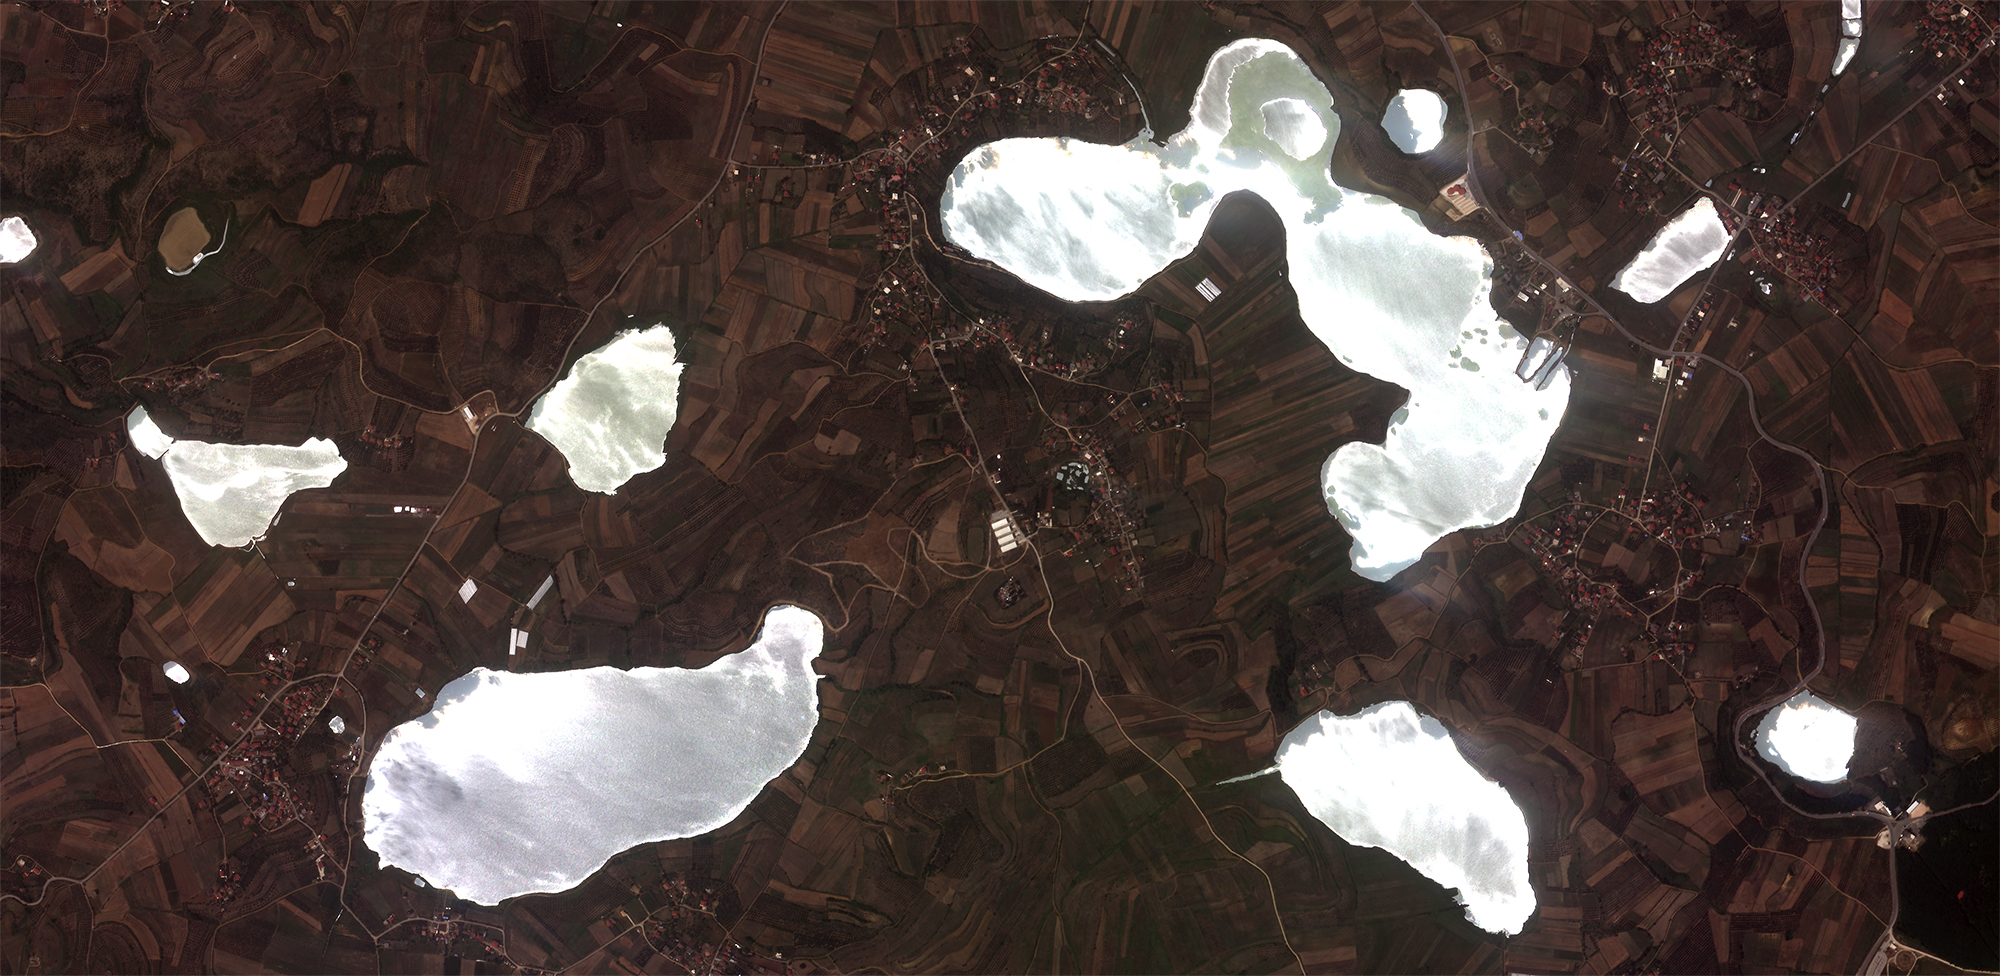
The following image is a RGB composition, real colors acquired in Belsh, a municipality in Elbasan County, central Albania, on 20th June 2024. The area of interest at 1:10.000 scale shows a flat region with lakes whose land use is based on agricultural practices.
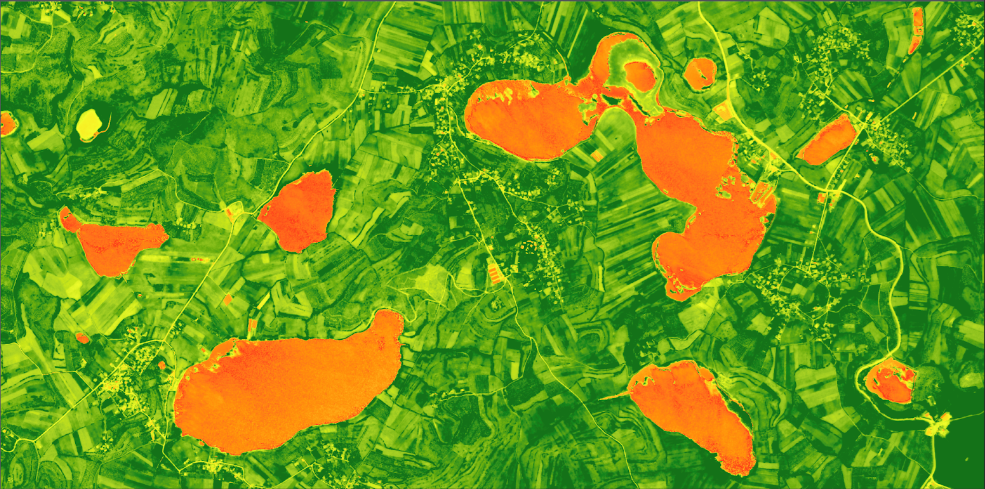
A NDVI (Normalized Difference Vegetation Index) has been calculated and applied using red and NIR bands. The derived product shows an index from 1 (dark green) to -1 (dark red). Values close to 1 enhance healthy vegetation and values close to -1 indicate no vegetation.
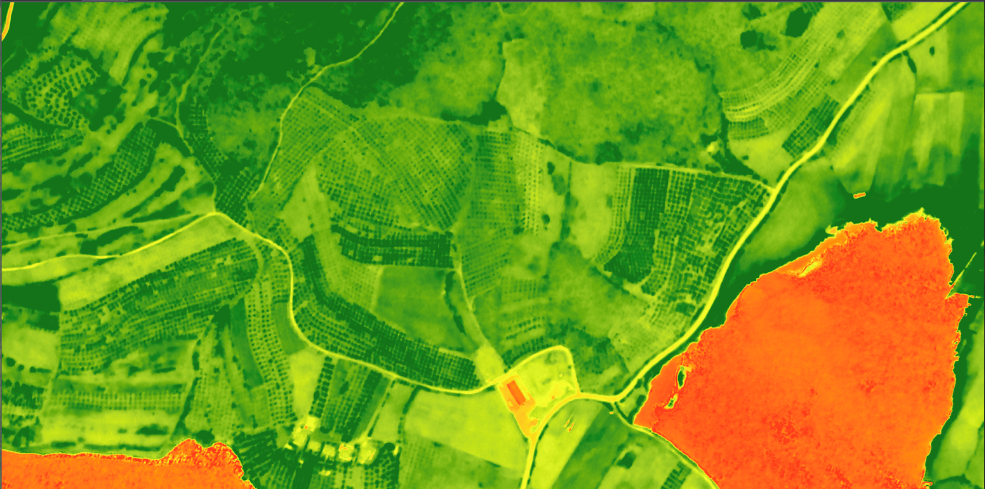
The NDVI detail at 1:2.500 scale shows the parcels with fruit trees. The main advantage of using Mark V is the potential to identify health for each single tree.
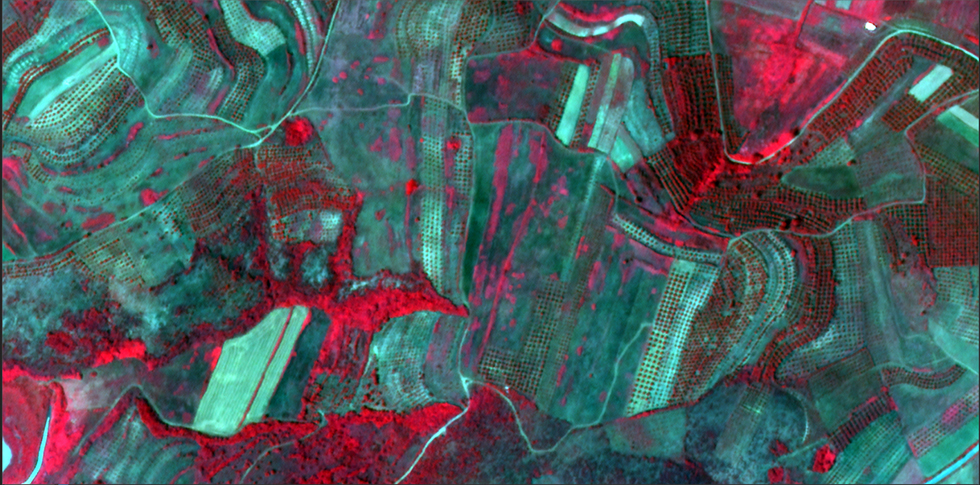
The following image is a false color composition, taking advantage of the Near Infrared band to highlight the vegetation in red tones. Bright tones indicate healthier vegetation and different phenological stages of the fruit trees. The phenological stage of the crop is closely related to its sensitivity to pests and diseases, helping to determine the most opportune treatment times to control the damage of numerous pathogens.
Forestry
Remote sensing and GIS are complementary technologies that, when combined, enable improved monitoring, mapping, and management of forest resources (Franklin 2001).
The main use cases of Remote Sensing in Forestry are the following:
- Accurate Forest Monitoring
- Efficient Inventory and Assessment
- Deforestation Monitoring and Prevention
- Fire Detection and Management
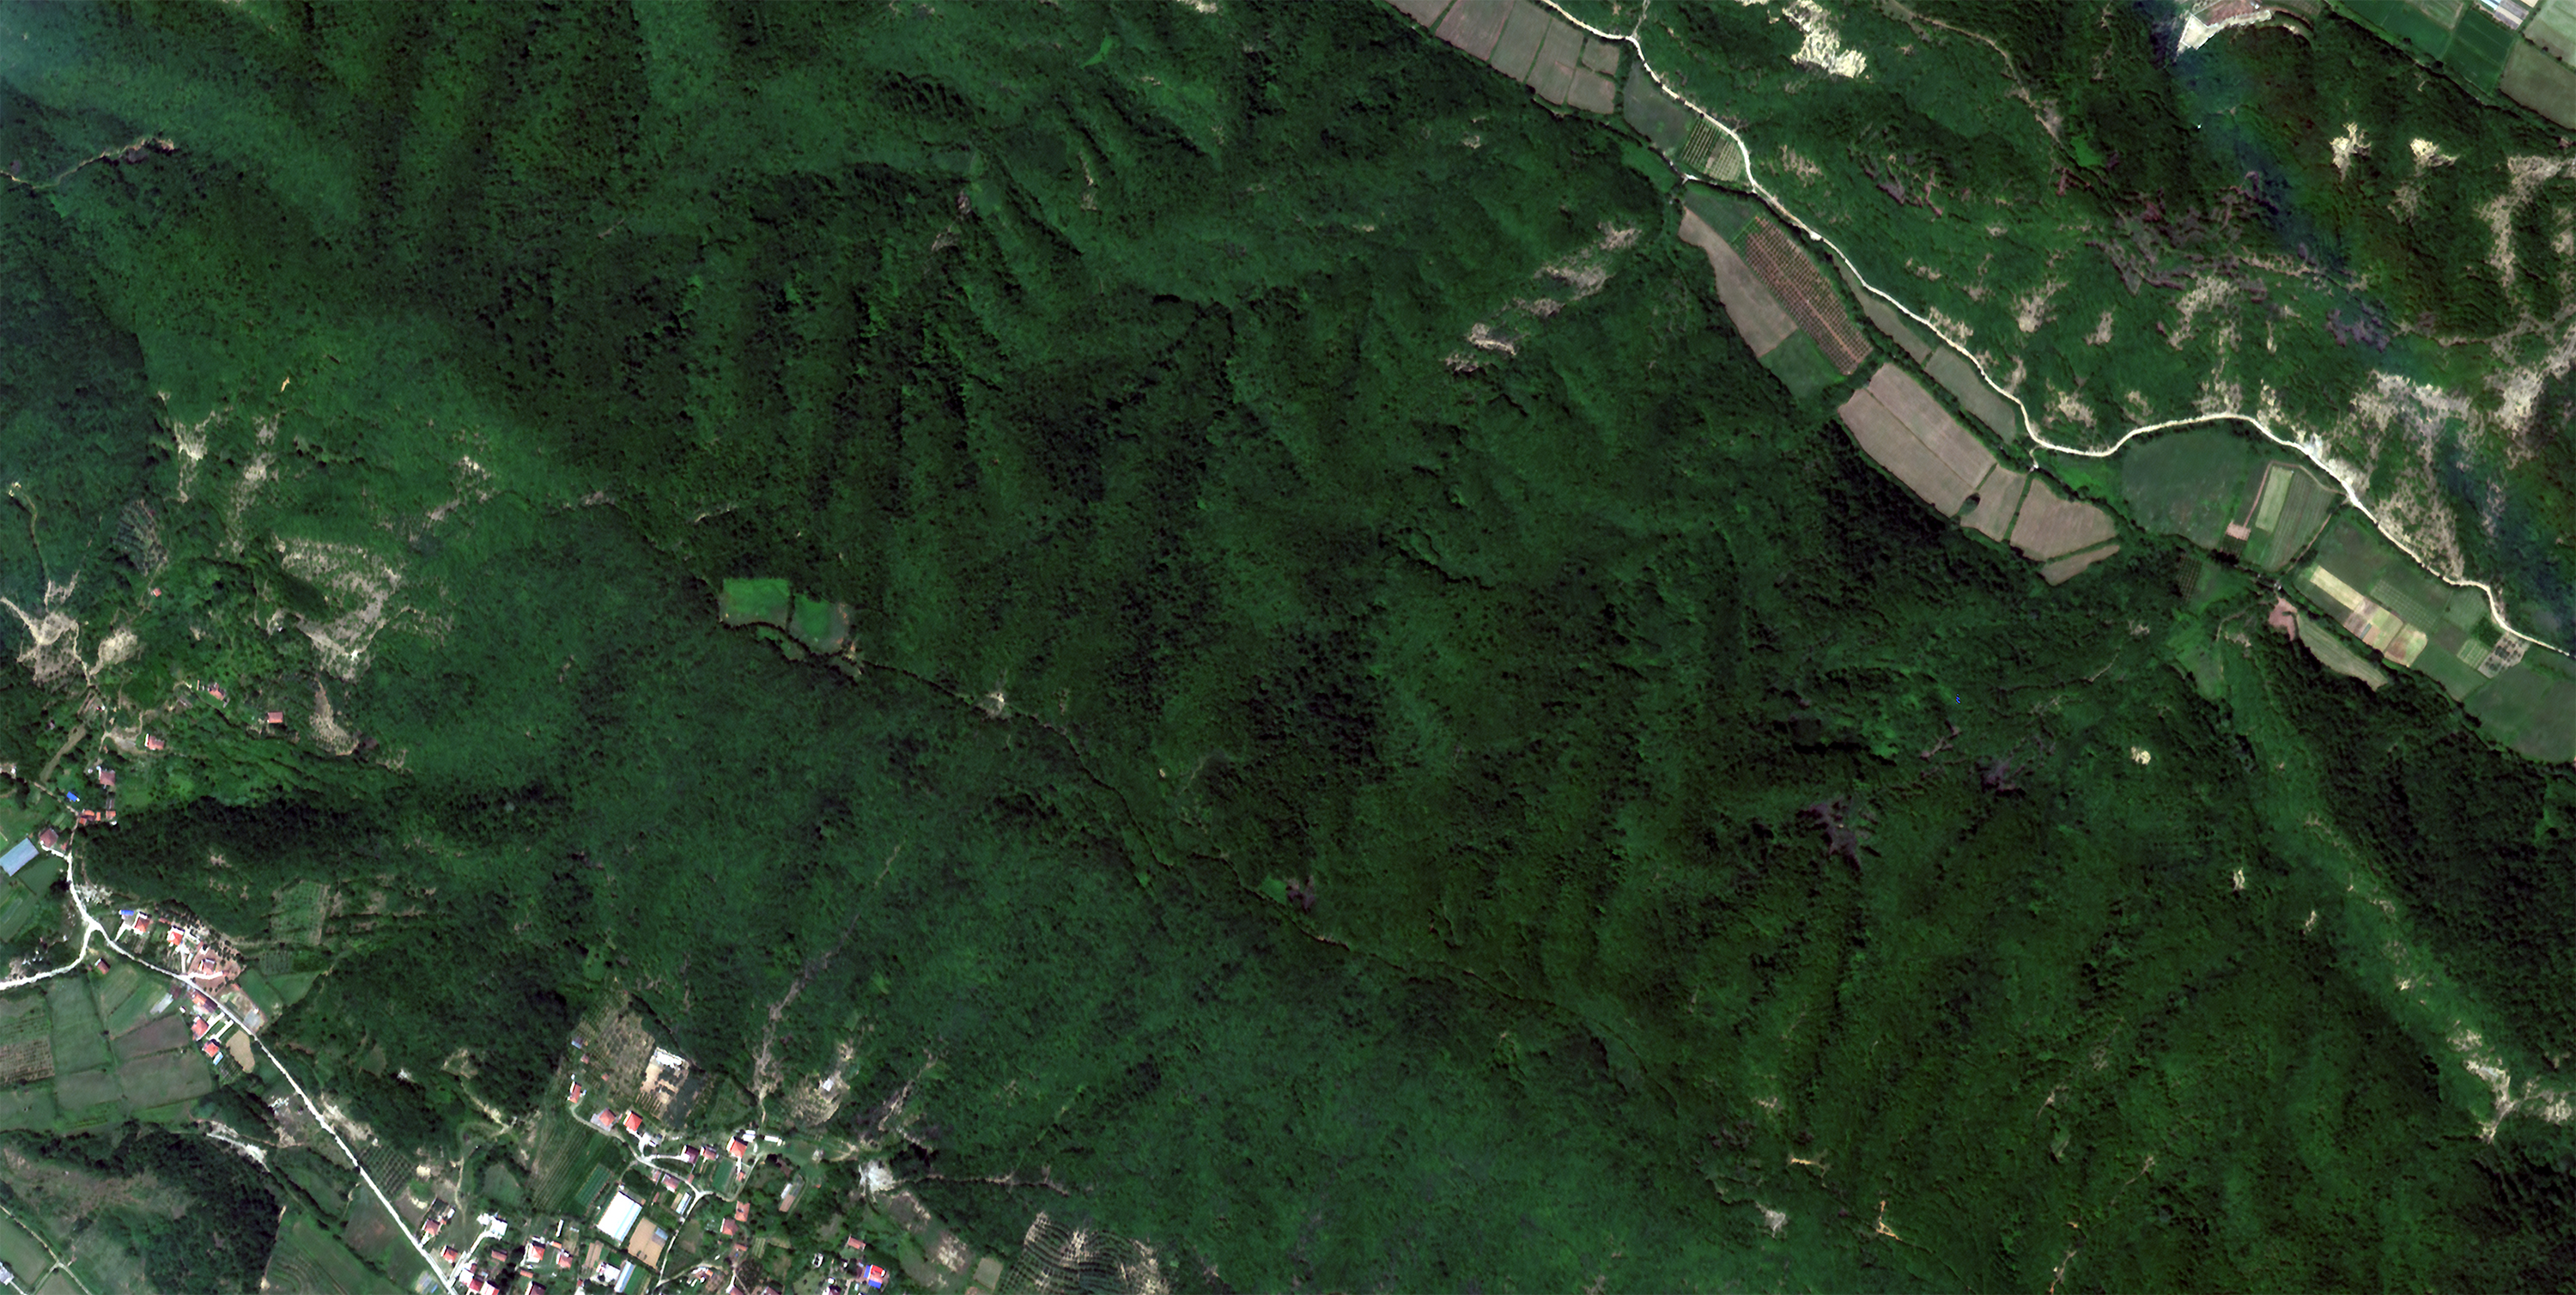
The following image is a RGB composition, real colors acquired in the north of Shkodër County, a county in northwestern Albania, on 15th June 2024. The area of interest at 1:10.000 scale shows a mountainous region with mixed forests, woodlands, and scrub.
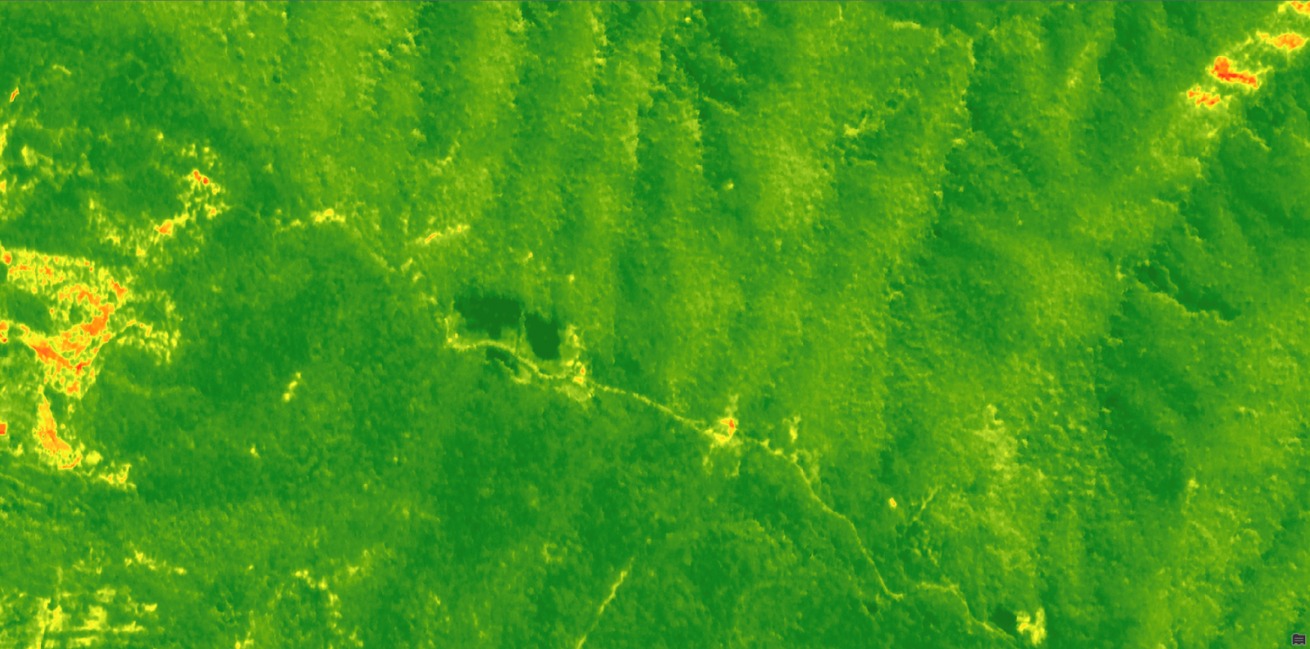
A NDVI (Normalized Difference Vegetation Index) has been calculated and applied using red and NIR bands. The derived product shows an index from 1 (dark green) to -1 (dark red). Values close to 1 enhance healthy vegetation and values close to -1 indicate no vegetation.
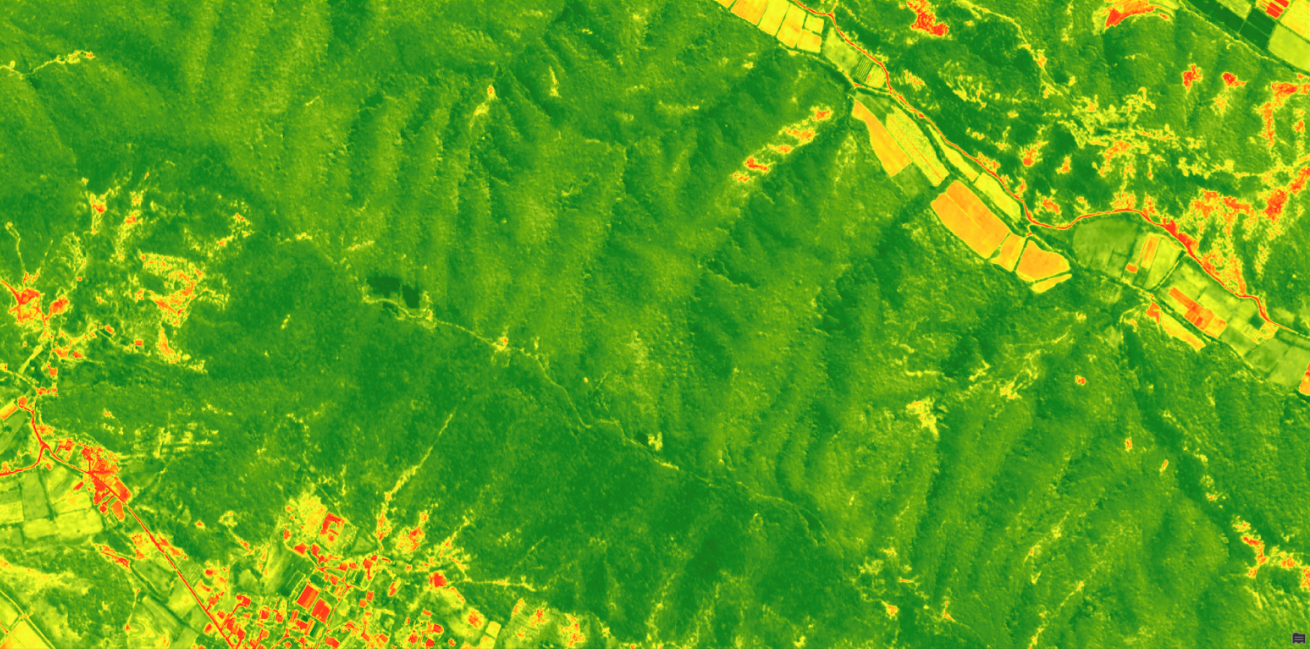
The NDVI detail at 1:2.500 scale shows the forest area. The main advantage of using Mark V is the potential to extract insights. For example the difference between north and south slopes, the presence of clear cuts, streams, tracks and trails or clusters of trees with less vegetative vigor,which could indicate diseases.
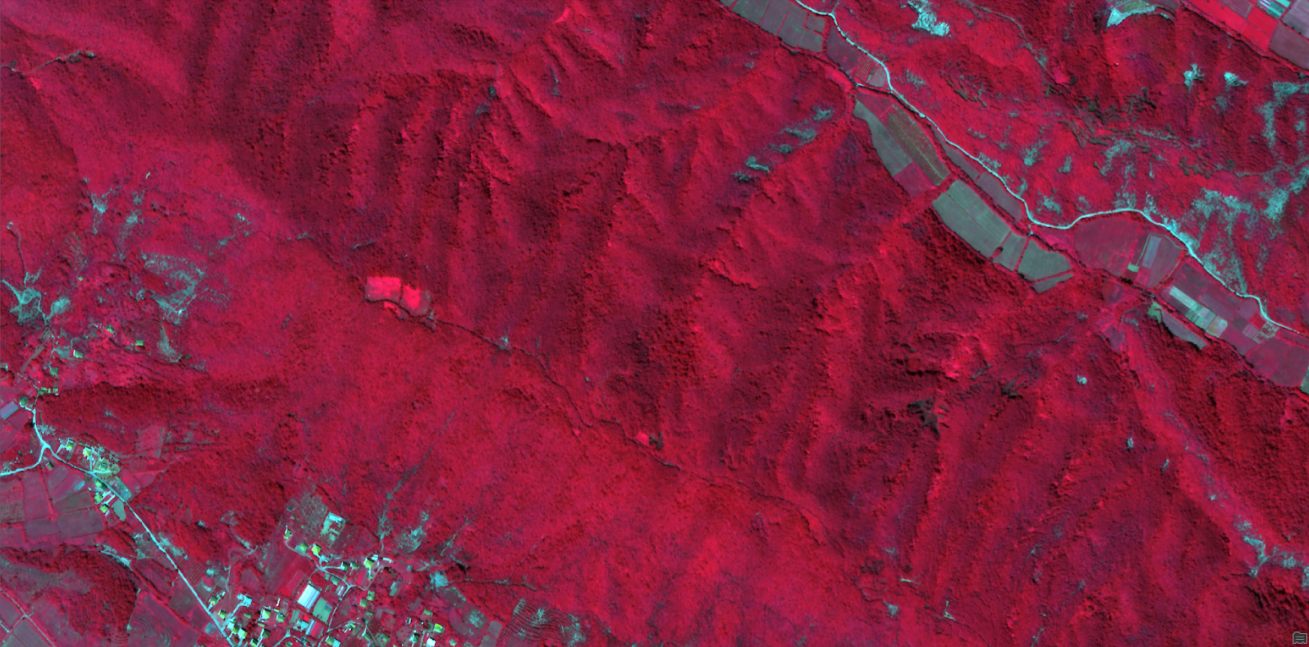
The following image is a false color composition, taking advantage of the Near Infrared band to highlight the vegetation in red tones. Bright tones indicate healthier vegetation and different phenological stages of the forests.
The Mark V satellite series is setting new standards in remote sensing for agriculture and forestry. By delivering accurate and detailed imagery, it allows for improved monitoring and management. Join us as we delve deeper into its applications and discover new ways it can benefit multiple industries. If you are interested in speaking with our sales team regarding Mark V imagery reach out below.
References
1 https://ohioline.osu.edu/factsheet/fabe-5541
2 https://www.mdpi.com/2072-4292/12/19/3136