Evolving EO Data and Analysis: Observations from an Industry Veteran
With more than 16 years of experience, a former NGA Imagery Analyst shares insight on changes in the industry poised to transform it.
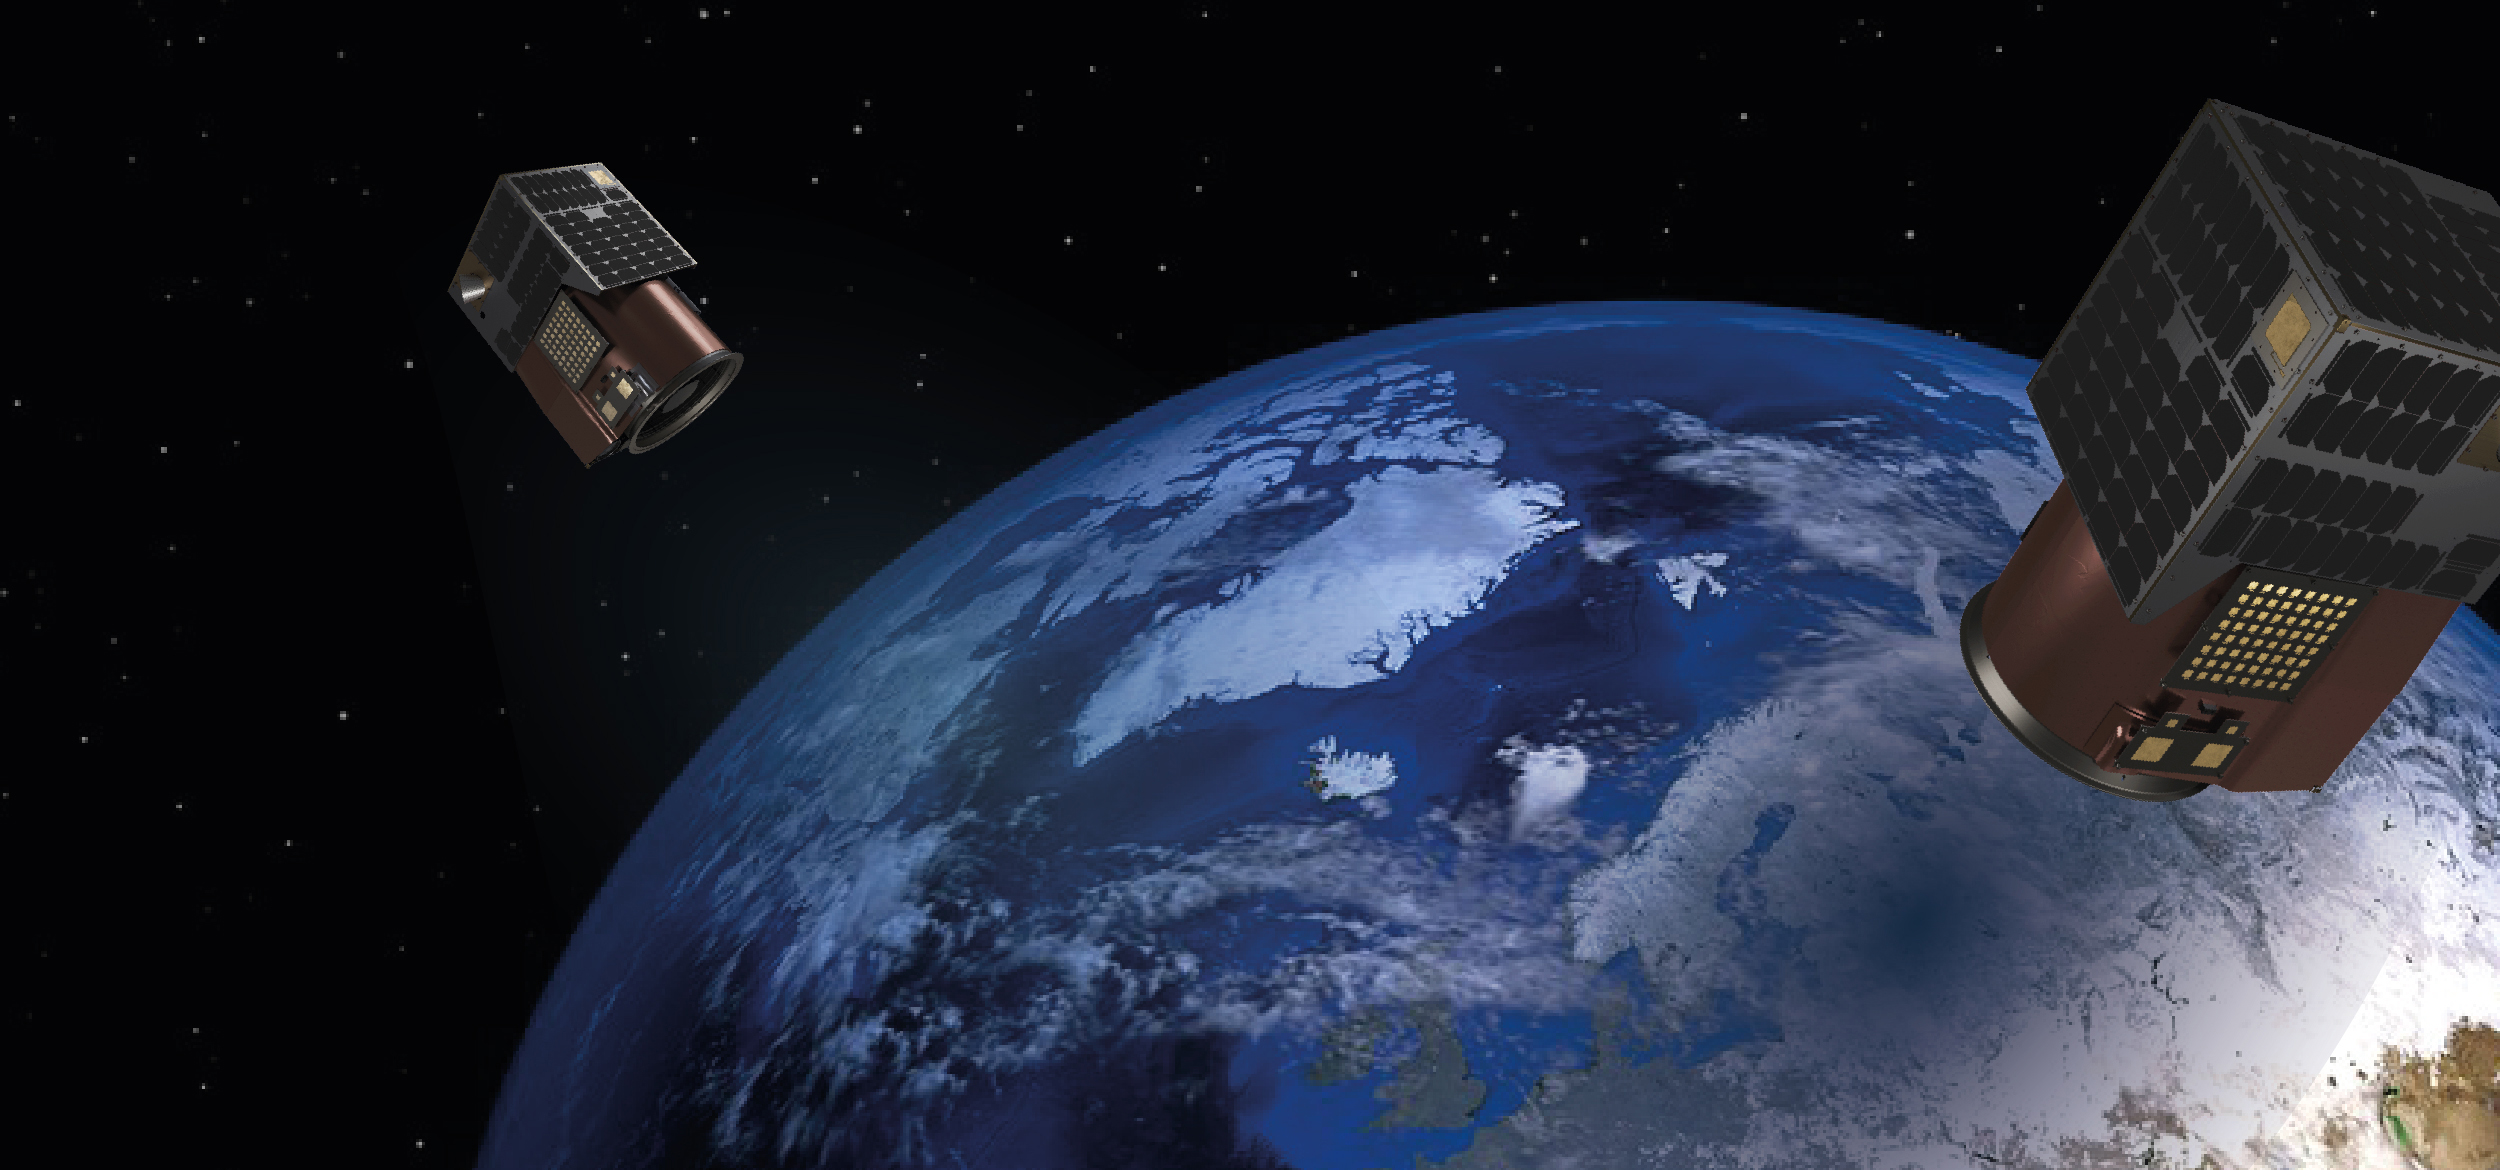
Several transitions are currently underway in the Earth Observation industry. Due to the rapid proliferation of commercial satellite technology, we have seen a radical reduction in manufacturing costs, which in turn shrunk the typical size of Earth Observation satellites, which increased available storage capacity on launch rockets, thereby enabling ride share microsat launches, leading to drastically increased access to satellites and Earth Observation data.
Because of those lower acquisition costs, the customer base of remotely sensed data has exponentially grown from dark rooms in the basements of government buildings, to universities, financial services companies, and smartphone apps. According to NY2O, a company that provides real-time tracking and pass predictions with orbital paths and footprints overlaid on Google Maps, there are 91 different countries or organizations currently operating a satellite.1
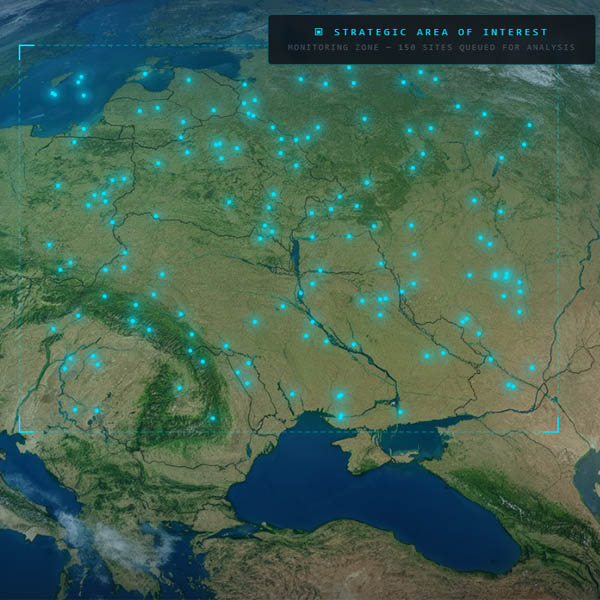
This deluge of data streaming down from above has opened the flood gates for companies to both ask and answer intelligence questions. The earth observation data industry has responded by moving towards insights as a service. Satellogic, as well as several other imagery vendors, either in-house or working with industry partners, can now collect, transmit, process, algorithmically analyze, and distribute an output, all with minimal direct human interaction. From mining to farming, to financial services and insurance, to defense and intelligence, the questions are as varied as the customers:
- What is the expected crop yield of locations A, B, C this season?
- How many new pilings were observed at mining company locations D, E, F during the previous quarter?
- How many submarines are docked at Sub Pens X, Y, Z on Fridays?
- Are there any new structures detected in county F, that have not been reported to the county surveyor’s revenue department?
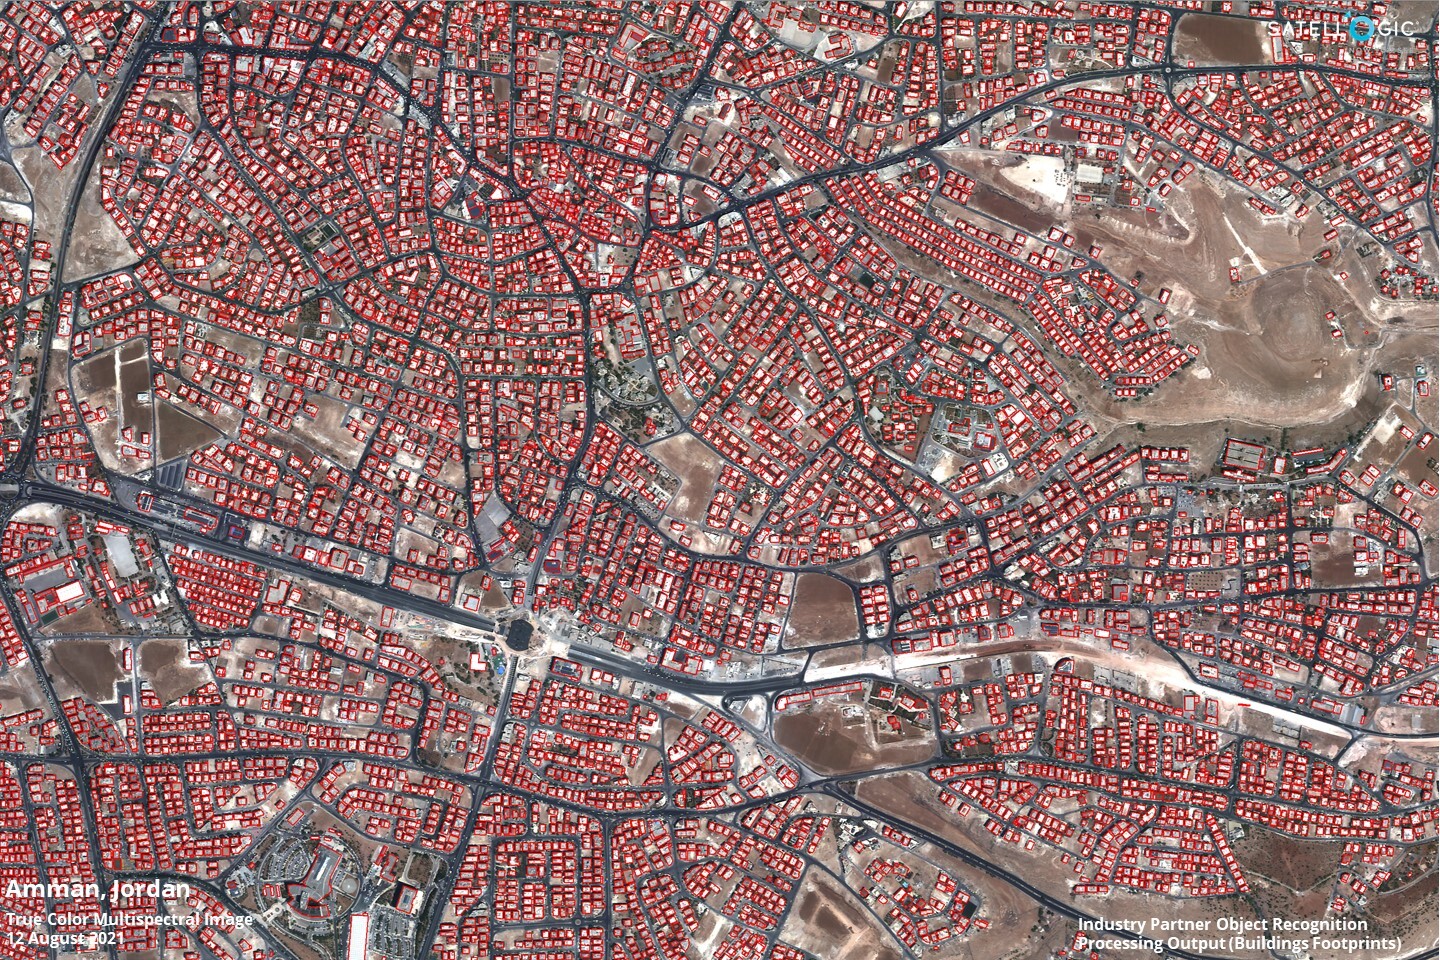
Using Satellogic’s high-resolution satellite imagery, analysts can run object detection models, like building footprints, to automate analytics at scale.
As the industry moves away from humans analyzing beautiful high-resolution images of an important location on earth, we are moving towards obtaining answers with automation. The global acceptance of remotely sensed data has grown proportionally with the sophistication of the industry. I for one, am excited for this transition. I’ve seen first-hand there are far too many images captured for humans to analyze each one individually, but with automated intelligence workflows analyzing the deluge of data flowing from space and sending notifications of an output we gain comprehensive insights and can prioritize analytical efforts to those alert notification events. Additionally, we can add a refined temporal component to the analytical insights. While baseline imagery has long been available, we are now introducing higher and higher revisit rates (multiple imagery captures per week or day) over the same spot on Earth. This empowers the end-user analysts from various industries by increasing the temporal component to their specific issue.
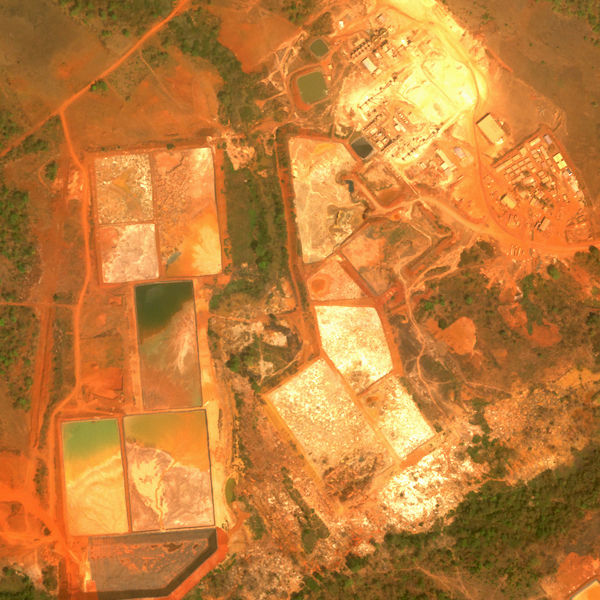
High-frequency collection enables remote asset monitoring, as seen here with 19 images collected over 13 days by Satellogic’s Aleph-1 constellation
With the industry shift towards “no-eyes” on the imagery, insights can be served up with a simple alert notification. One challenge that I heard repeatedly from government folks was how to validate the output of this answer automation cycle. There currently exists no internationally accepted quality assurance output model, a valid concern, but the international standards organization community is trying to establish a quality certification standard. In the interim, Satellogic has leaned heavily into providing the data-as-a-service model, thereby empowering trusted partners already well placed within the industry. Until such standards exist, satellite data industry partners can increase confidence by practices such as model rotation and refreshing annotations on a regular interval.
We are truly entering an age where space-based information will dominate decision cycles on earth. As decision-makers fuse disparate pieces of information together, increasing the speed of those information segments is paramount. I feel fortunate to be in a position where I can help speed up the question-to-answer cycle for important global issues.
[1] According to N2YO, there are 91 countries or organizations that operate/have access to satellites today.